
For founders
Answers without the hire.
Get the numbers you need to make decisions without waiting weeks for a data analyst to come on board.
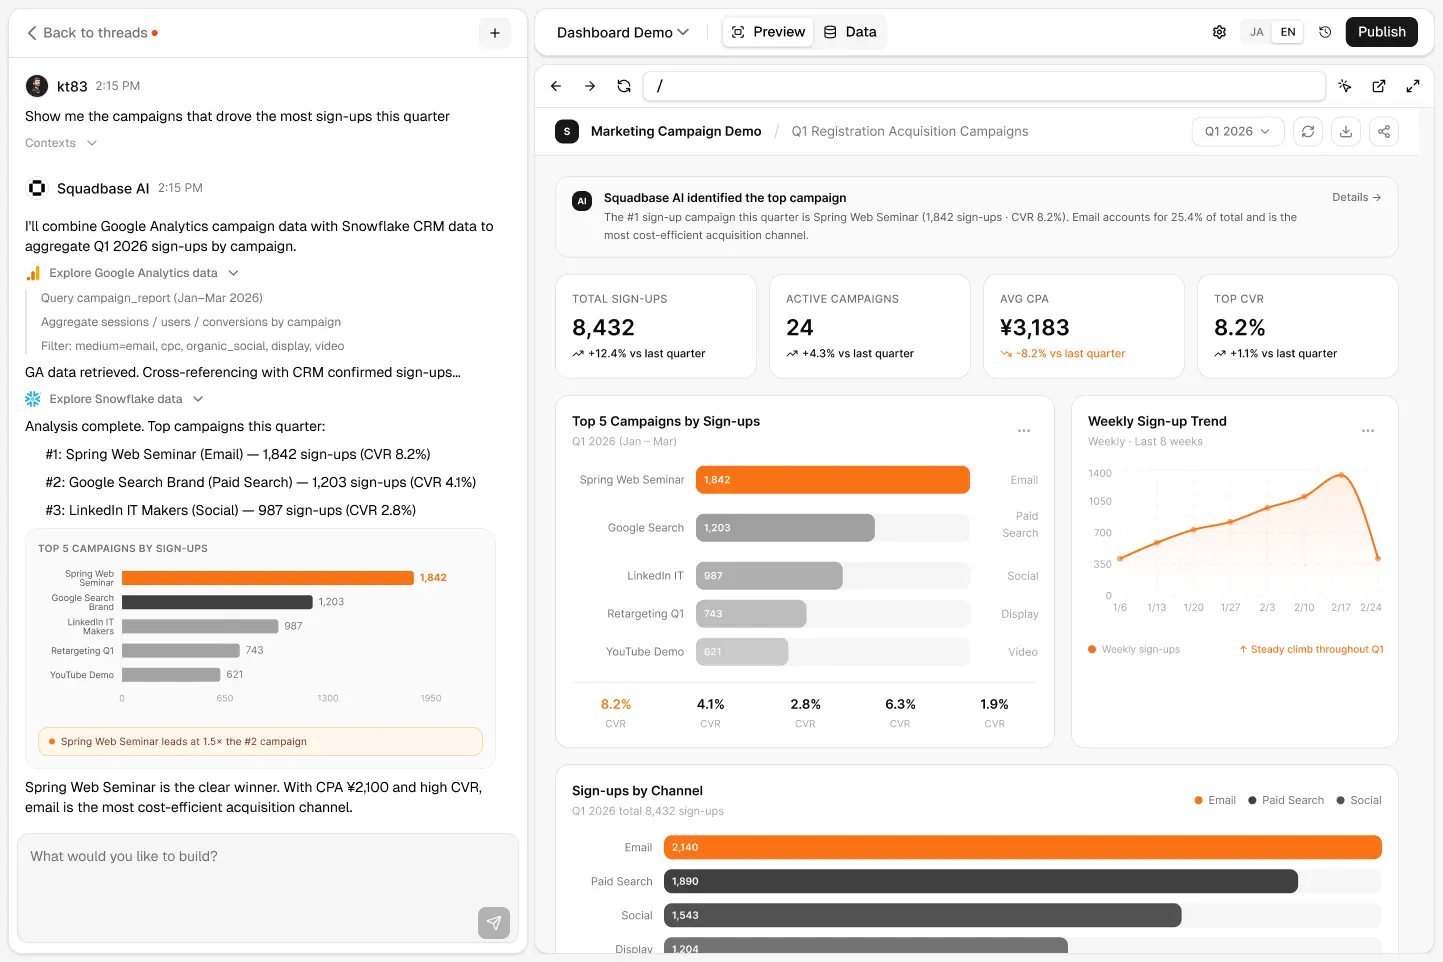
Connect your data, type what you want to know, and get a chart in seconds. Nothing to configure. Nothing to maintain.
A data agent is an AI that understands your business, answers questions in plain English, and turns them into shareable dashboards — without setup, modeling, or SQL.
Get the numbers you need to make decisions without waiting weeks for a data analyst to come on board.
Let the rest of the company self-serve. You focus on the deep work, not the dashboard backlog.
Track campaigns, pipeline, and outcomes in plain English — no more waiting on the data team for one-off reports.
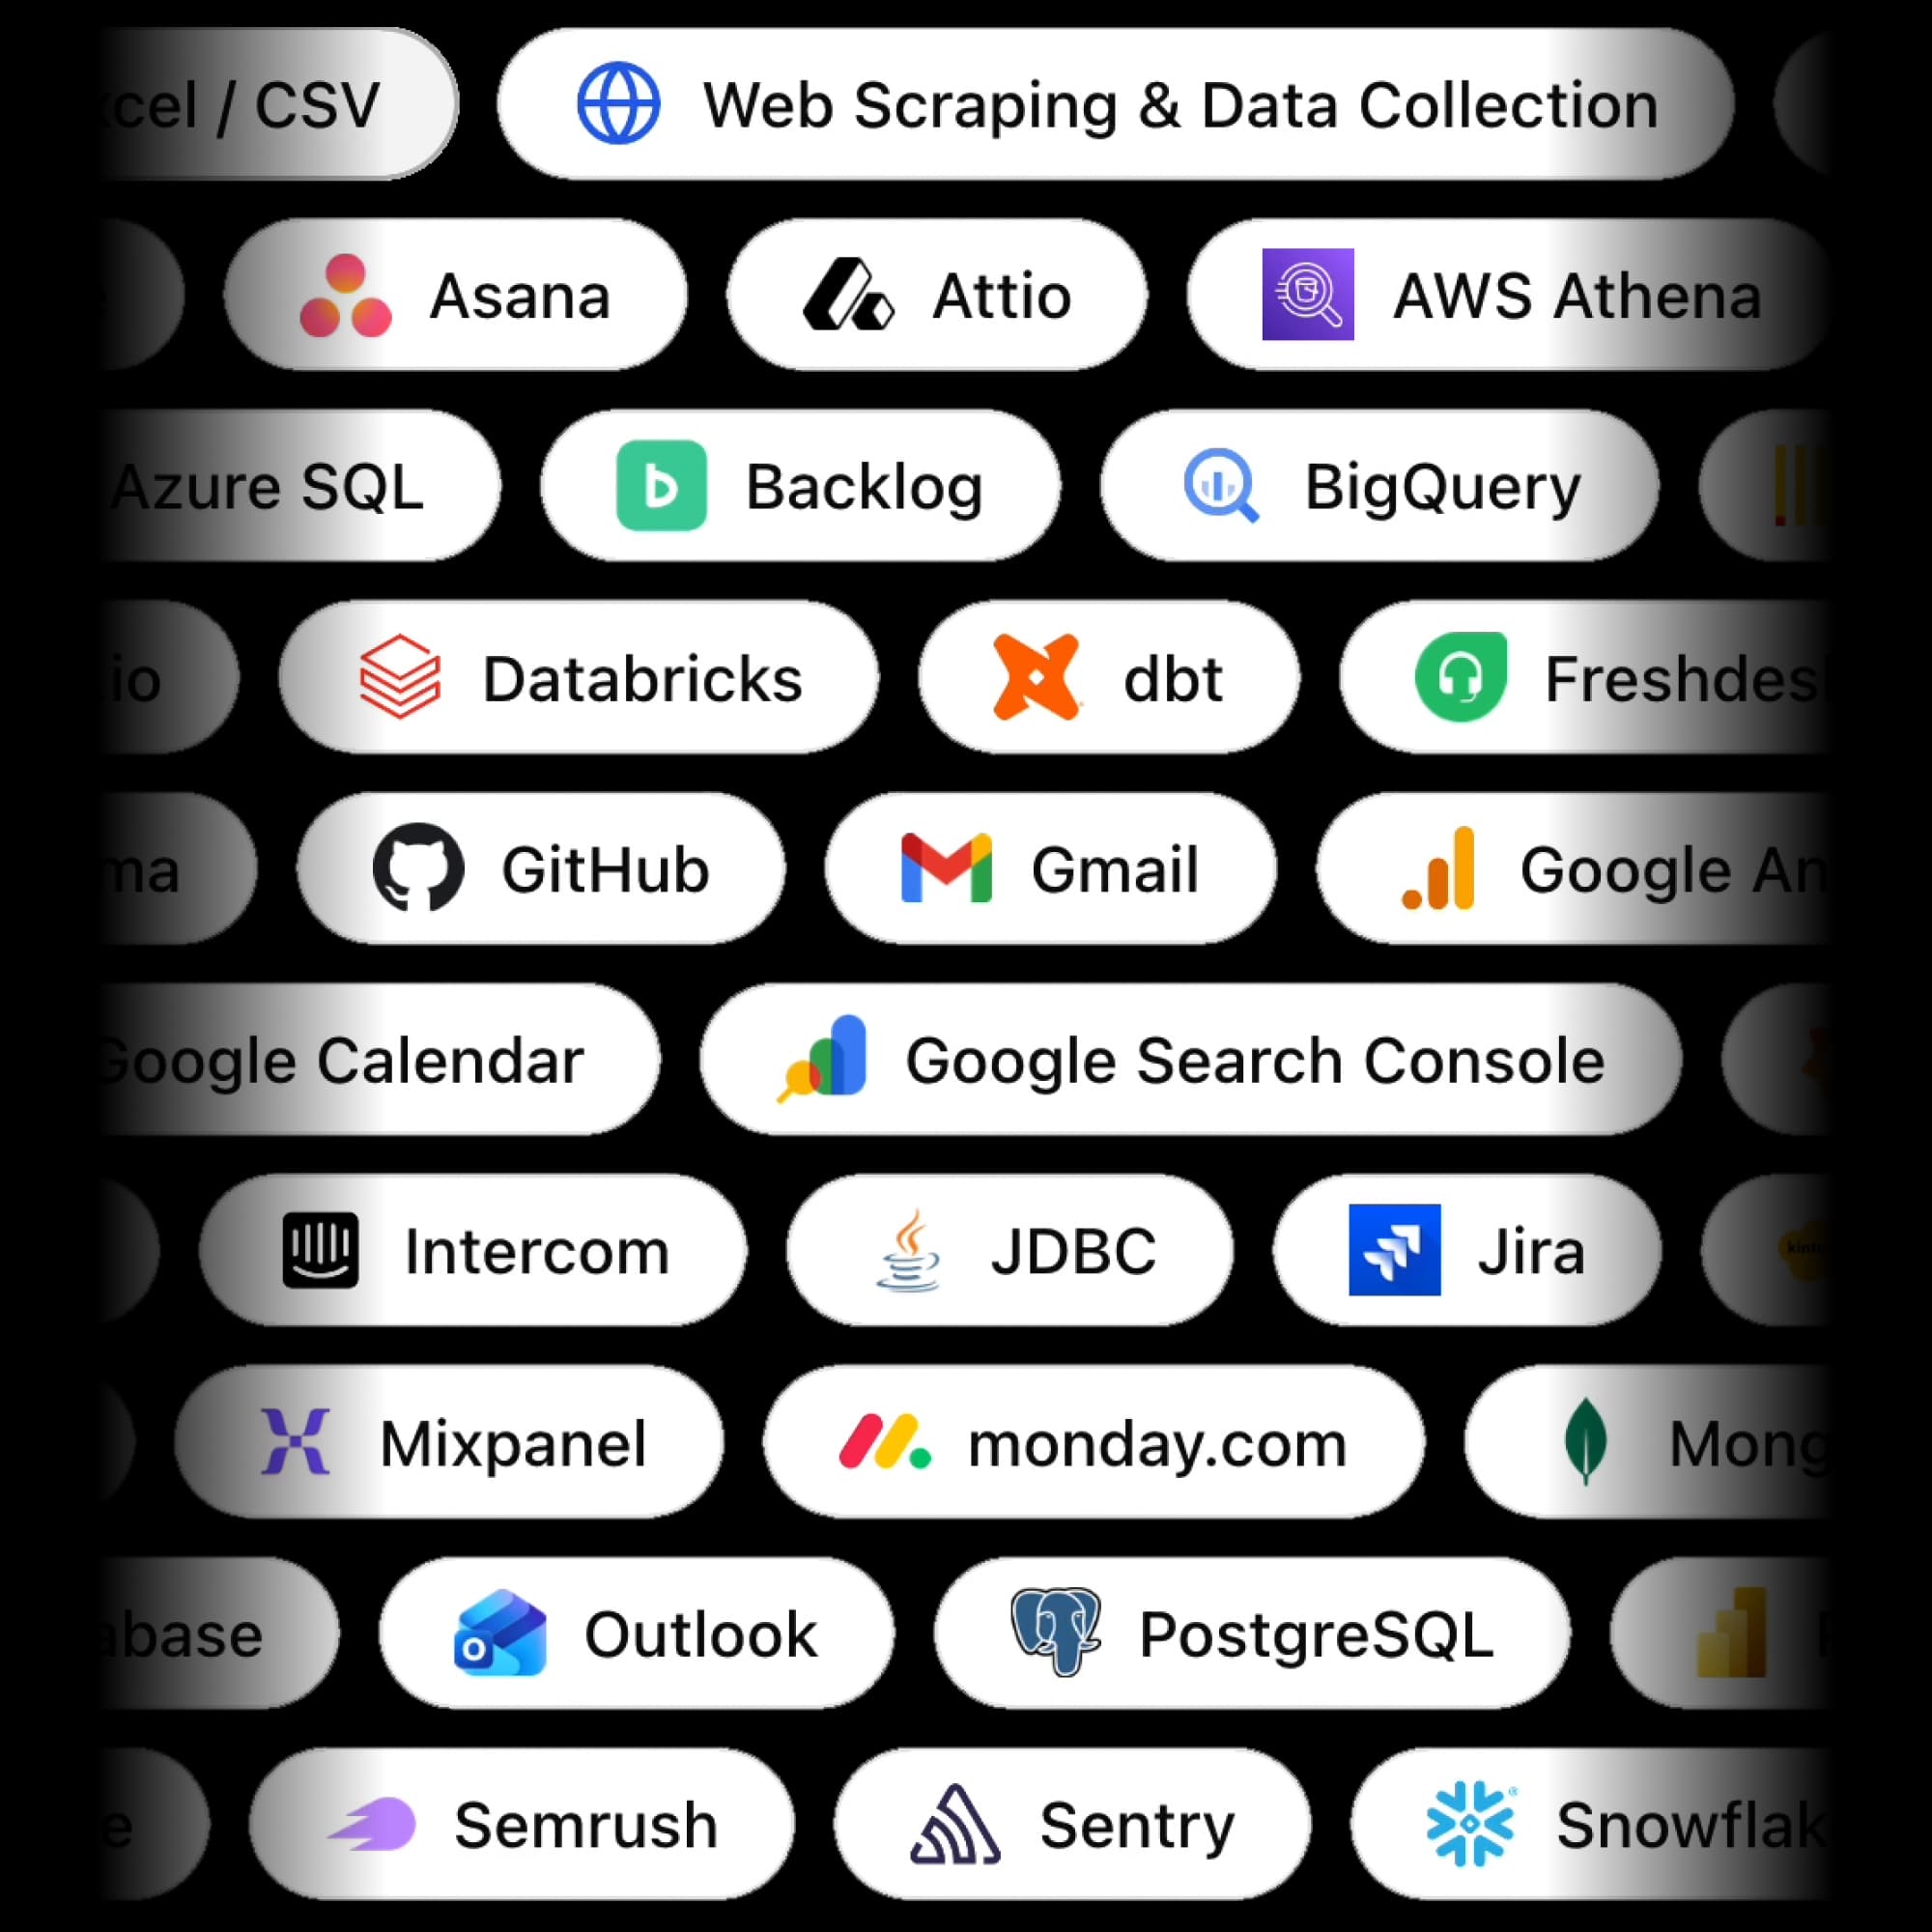
Your database, spreadsheet, or warehouse. Squadbase reads your schema automatically — no data model to define, no credentials to hunt down. Done in minutes.
Your database, spreadsheet, or warehouse. Squadbase reads your schema automatically — no data model to define, no credentials to hunt down. Done in minutes.
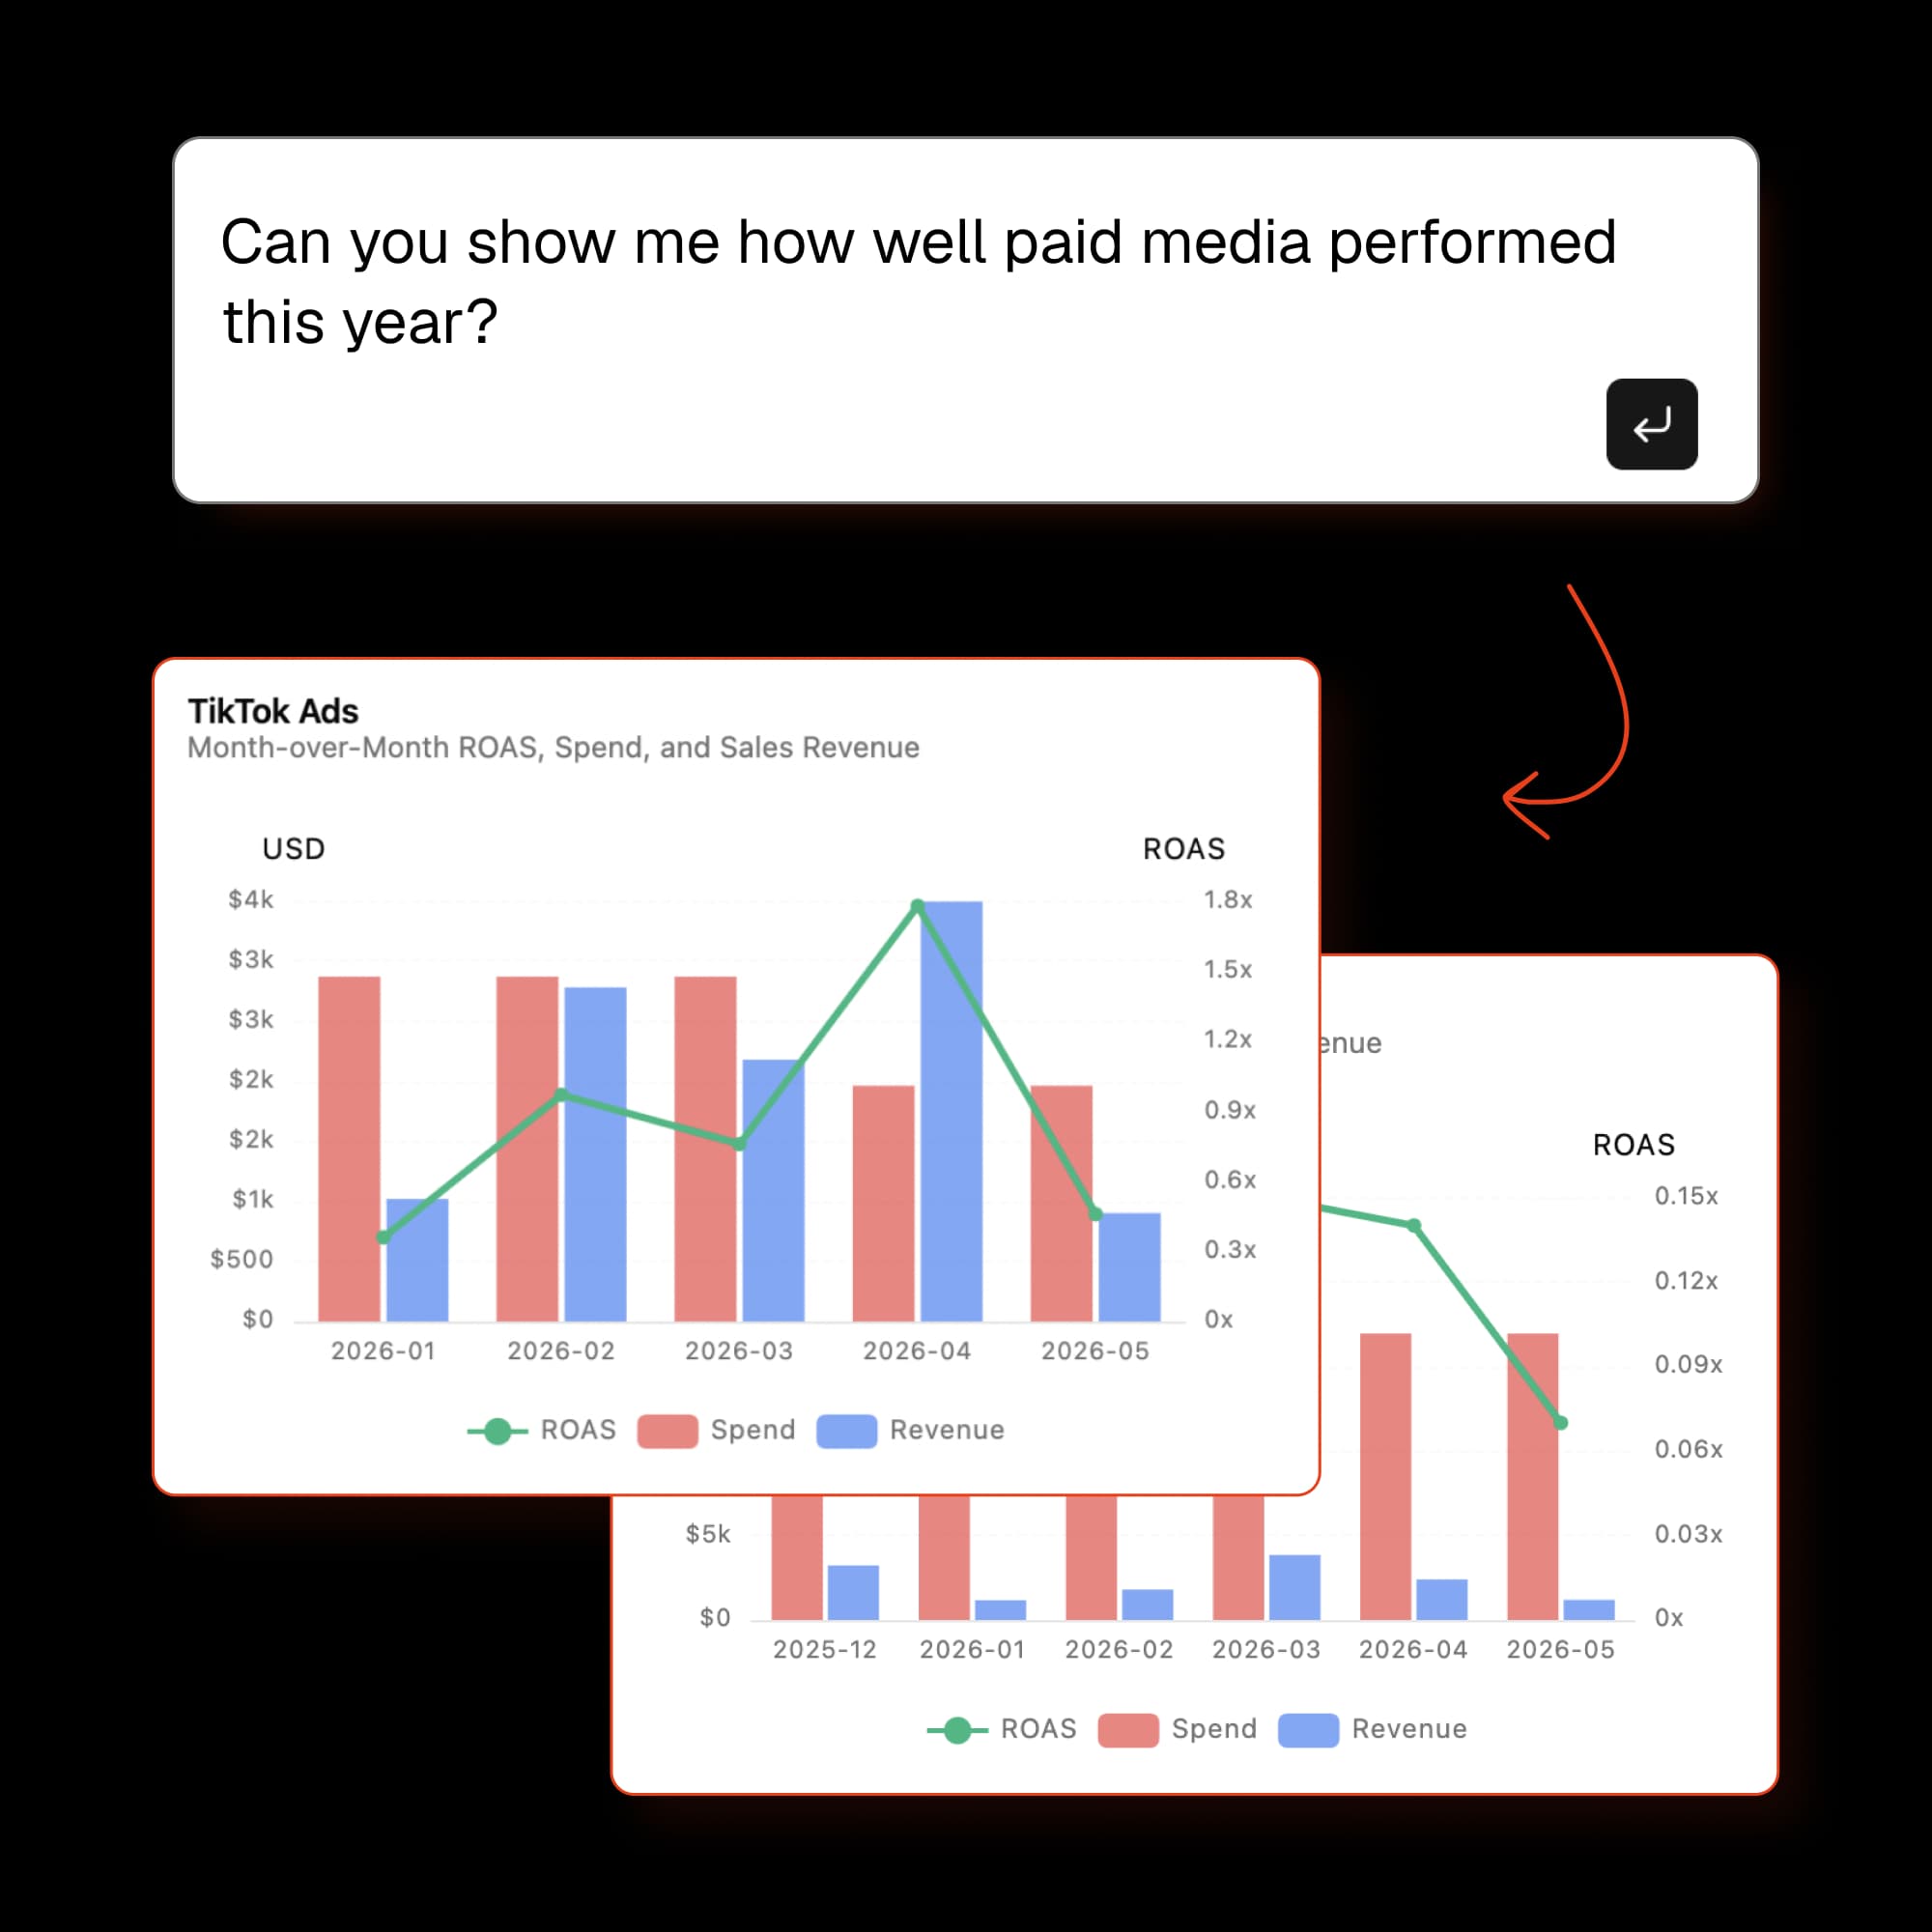
In plain English. “Show me revenue by channel last quarter.” No SQL. No chart configuration. No selecting axes or choosing chart types.
A clean chart in seconds. Share via link at no extra cost. Updates automatically when your data changes — nothing to maintain.
From zero to your first useful chart in under 5 minutes. No onboarding calls, no technical setup.
Ask in plain English and get the right chart back. Your question is your query.
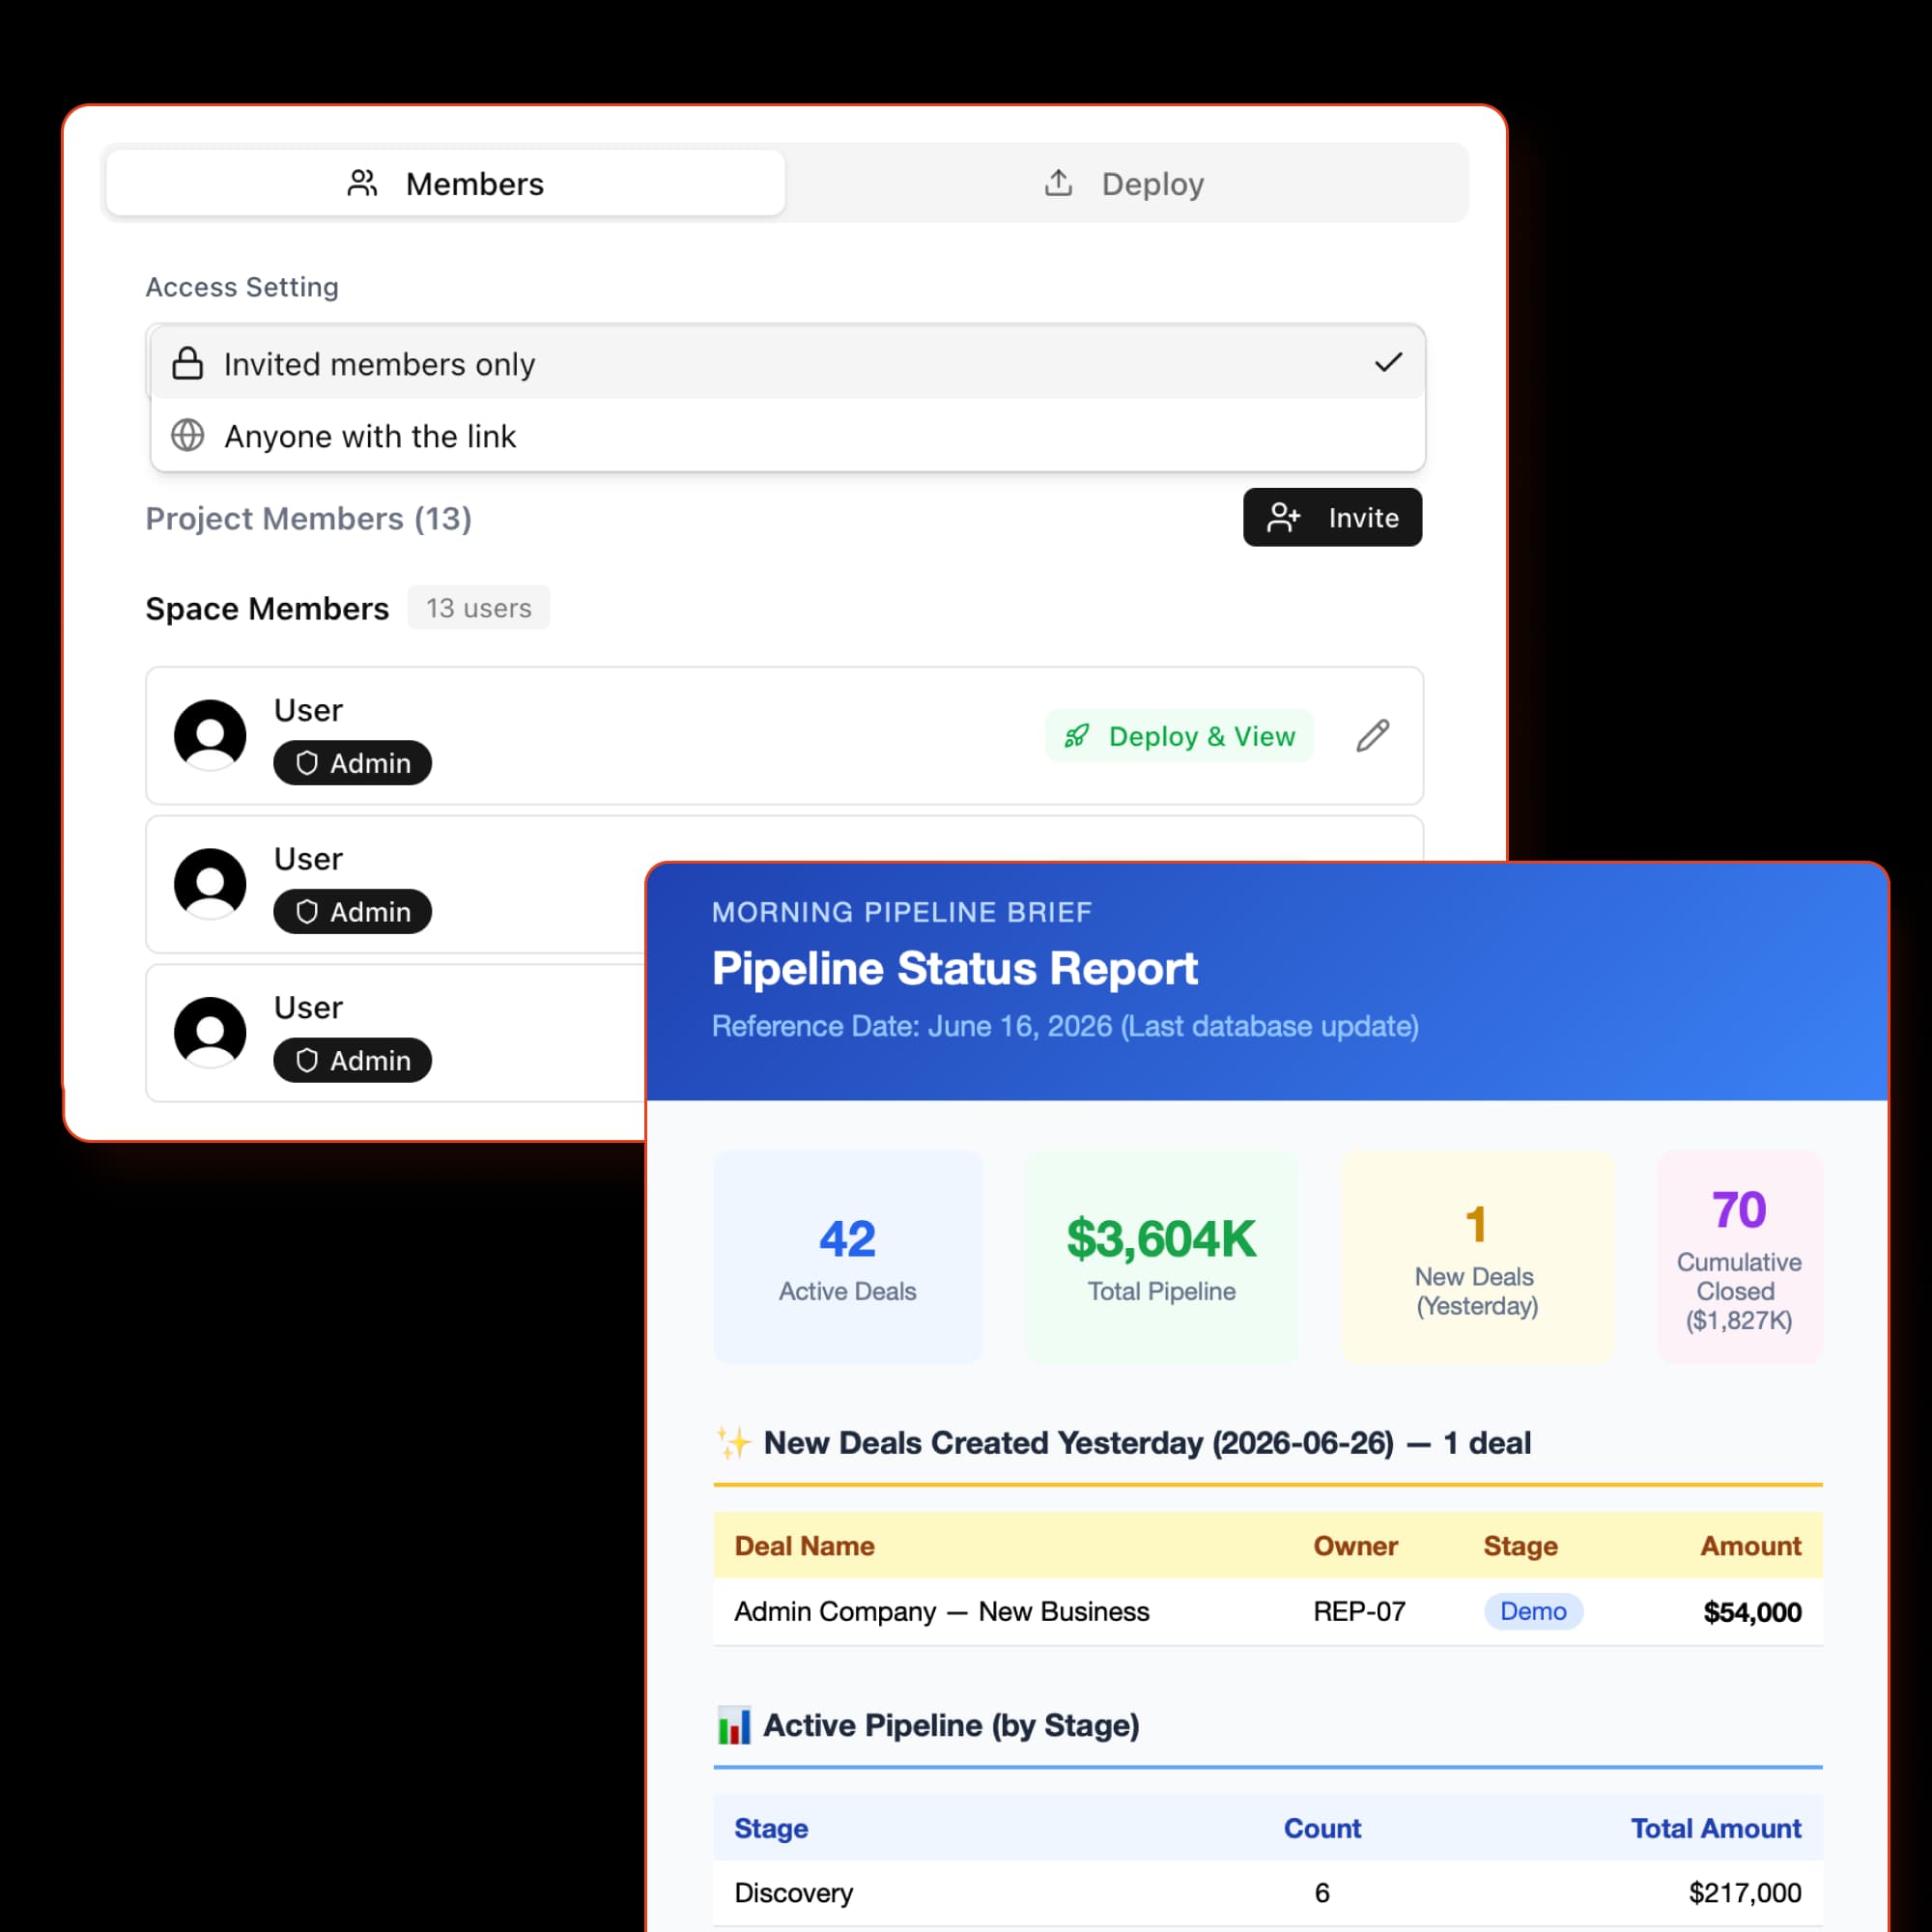
Viewers don't cost extra. Send a link, no seat license required.
Learns your schema, your metrics, and your terminology over time.
Flags anomalies and trends you didn't think to ask about.
Schema changes don't break your questions. Nothing to maintain when your data evolves.
We couldn't see our purchasing lead times or dead stock, so decisions came down to gut feel. Just by importing CSVs into Squadbase, the dashboards took shape, and as the data accumulated, we were able to build a genuinely healthy cash-flow management practice.
When fluctuations appear in our monitoring metrics, we can intuitively expand our analysis using natural language — no time spent writing queries. It enables rapid root cause investigation and has become a foundation for our continuous improvement cycle.
Updating our fan-facing data visualization pages used to require designers and engineers, which made every change a major effort. With Squadbase, I just describe what I want and a dashboard takes shape — even as a non-engineer, I can now test ideas instantly.
The BI tool from another vendor that we previously used required specialized knowledge to set up and manage dashboards. With Squadbase, we can quickly create dashboards using generative AI, making it easier to leverage data for everyday decision-making.W&B Consulting
What used to be a multi-step manual transfer from WixStore to spreadsheets now happens in a single screen with Squadbase. The biggest strength is being able to add features just by typing a request into the chat, so the system keeps evolving with our team's needs.
We used to spend enormous time on manual checks every month, but AI-powered automated matching has dramatically reduced our workload. Inconsistencies between staff members have been eliminated — it's a highly practical tool that achieves both efficiency and quality.
Squadbase made it genuinely easy to build applications on top of Snowflake. The setup was straightforward, and we were able to move from our data to a working app quickly without any unnecessary friction.
Viewers are always free — every plan, no exceptions.
For individuals exploring their data.
Start free →For solo builders going all-in.
Start Individual →For professionals who need more.
Start Pro →For teams with shared data needs.
Start Team →Enterprise? Talk to us →
Squadbase skips the modeling, dashboard-building, and semantic-layer work. You connect a data source and ask questions in plain English — we turn them into SQL, run them, and show you the chart. No setup, no training required.
An AI data analyst is software that answers questions about your business data in plain English — no SQL, dashboards, or technical setup required. Instead of waiting on a human analyst or building reports manually, you ask a question and get a chart or answer instantly. Squadbase is built around this concept: it connects directly to your existing data sources and stays always-on, so it can monitor metrics and flag changes automatically.
No. Anyone on your team can ask questions in plain English. If you do know SQL, you can drop into the editor at any time to tweak or extend what Squadbase generated.
Postgres, MySQL, BigQuery, Snowflake, Redshift, and direct CSV / spreadsheet uploads today. More warehouses and SaaS connectors are on the roadmap.
We read data through a least-privilege connection, never store it in plaintext, and support SSO + SAML on the Team plan. SOC 2 Type II is in progress.
Yes. Viewers are free on every plan — share a link, gate with your workspace, or embed a live chart in a doc.
You can keep viewing existing charts, but new queries pause until the next month or until you upgrade. No surprise bills.
Yes — Pro and Team plans start with a 14-day free trial. No credit card required to start.
Be the first to try our new autonomous AI agents when we launch. No credit card, no commitment — just your email.