Business intelligence,
built by AI
No SQL. No chart builders. Ask your AI data analyst a question — it builds an interactive BI dashboard for you.
Your AI data analyst connects to all your data
 Excel/CSV
 Snowflake
 BigQuery
 dbt
dbt AWS Athena
 PostgreSQL
 Google Analytics
 Airtable
 kintoneExcel/CSVSnowflakeBigQuerydbtAWS AthenaPostgreSQLGoogle AnalyticsAirtablekintoneExcel/CSVSnowflakeBigQuerydbtAWS AthenaPostgreSQLGoogle AnalyticsAirtablekintoneExcel/CSVSnowflakeBigQuerydbtAWS AthenaPostgreSQLGoogle AnalyticsAirtablekintone
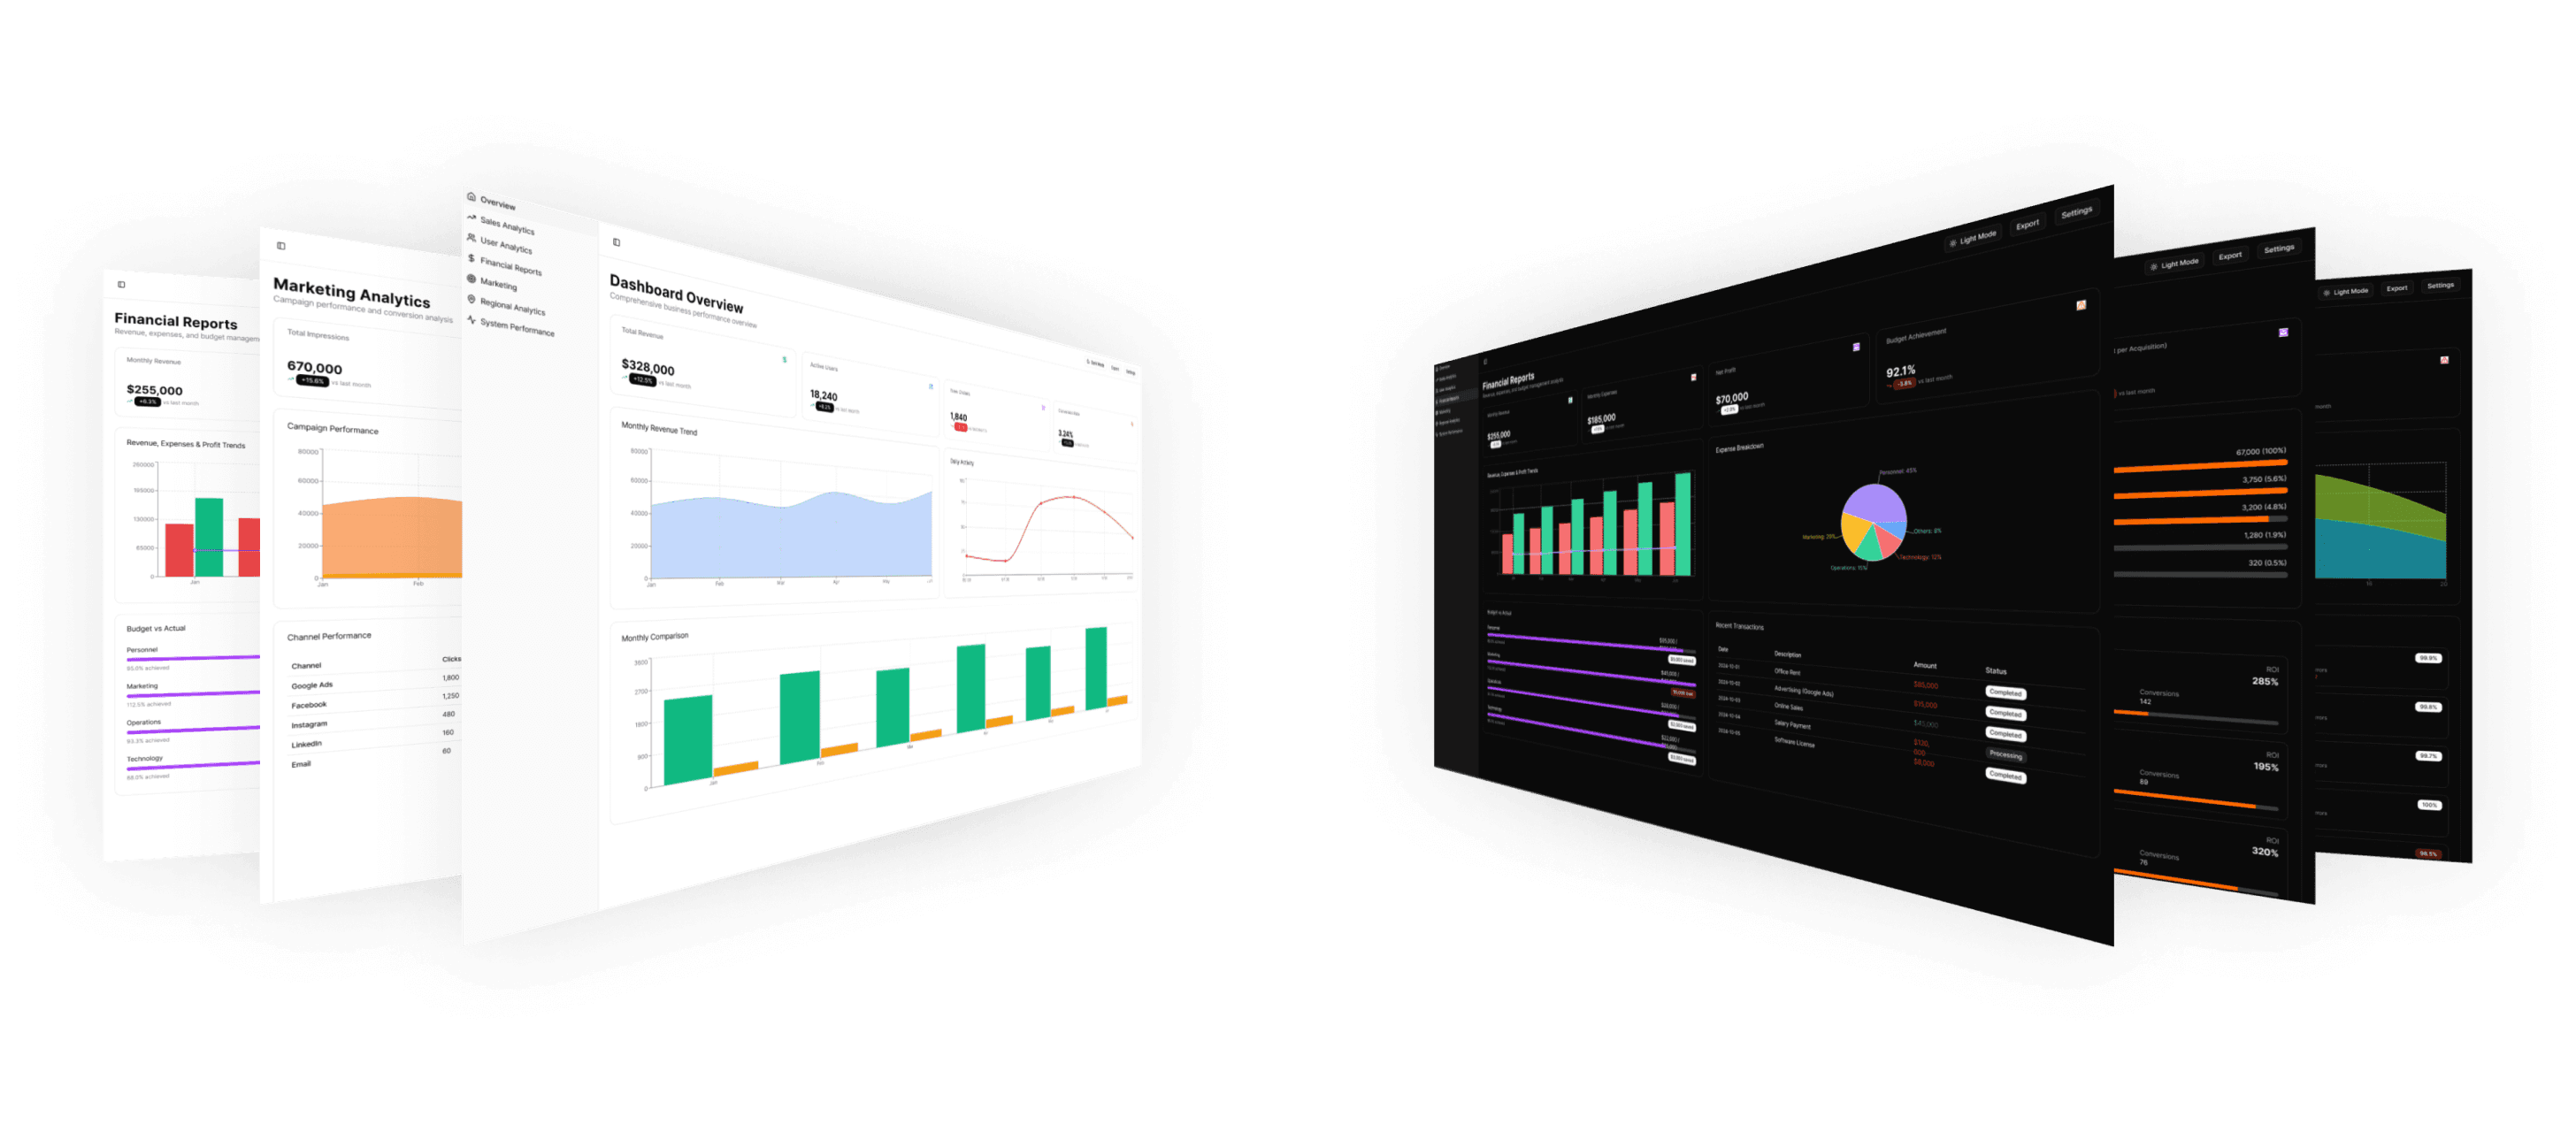
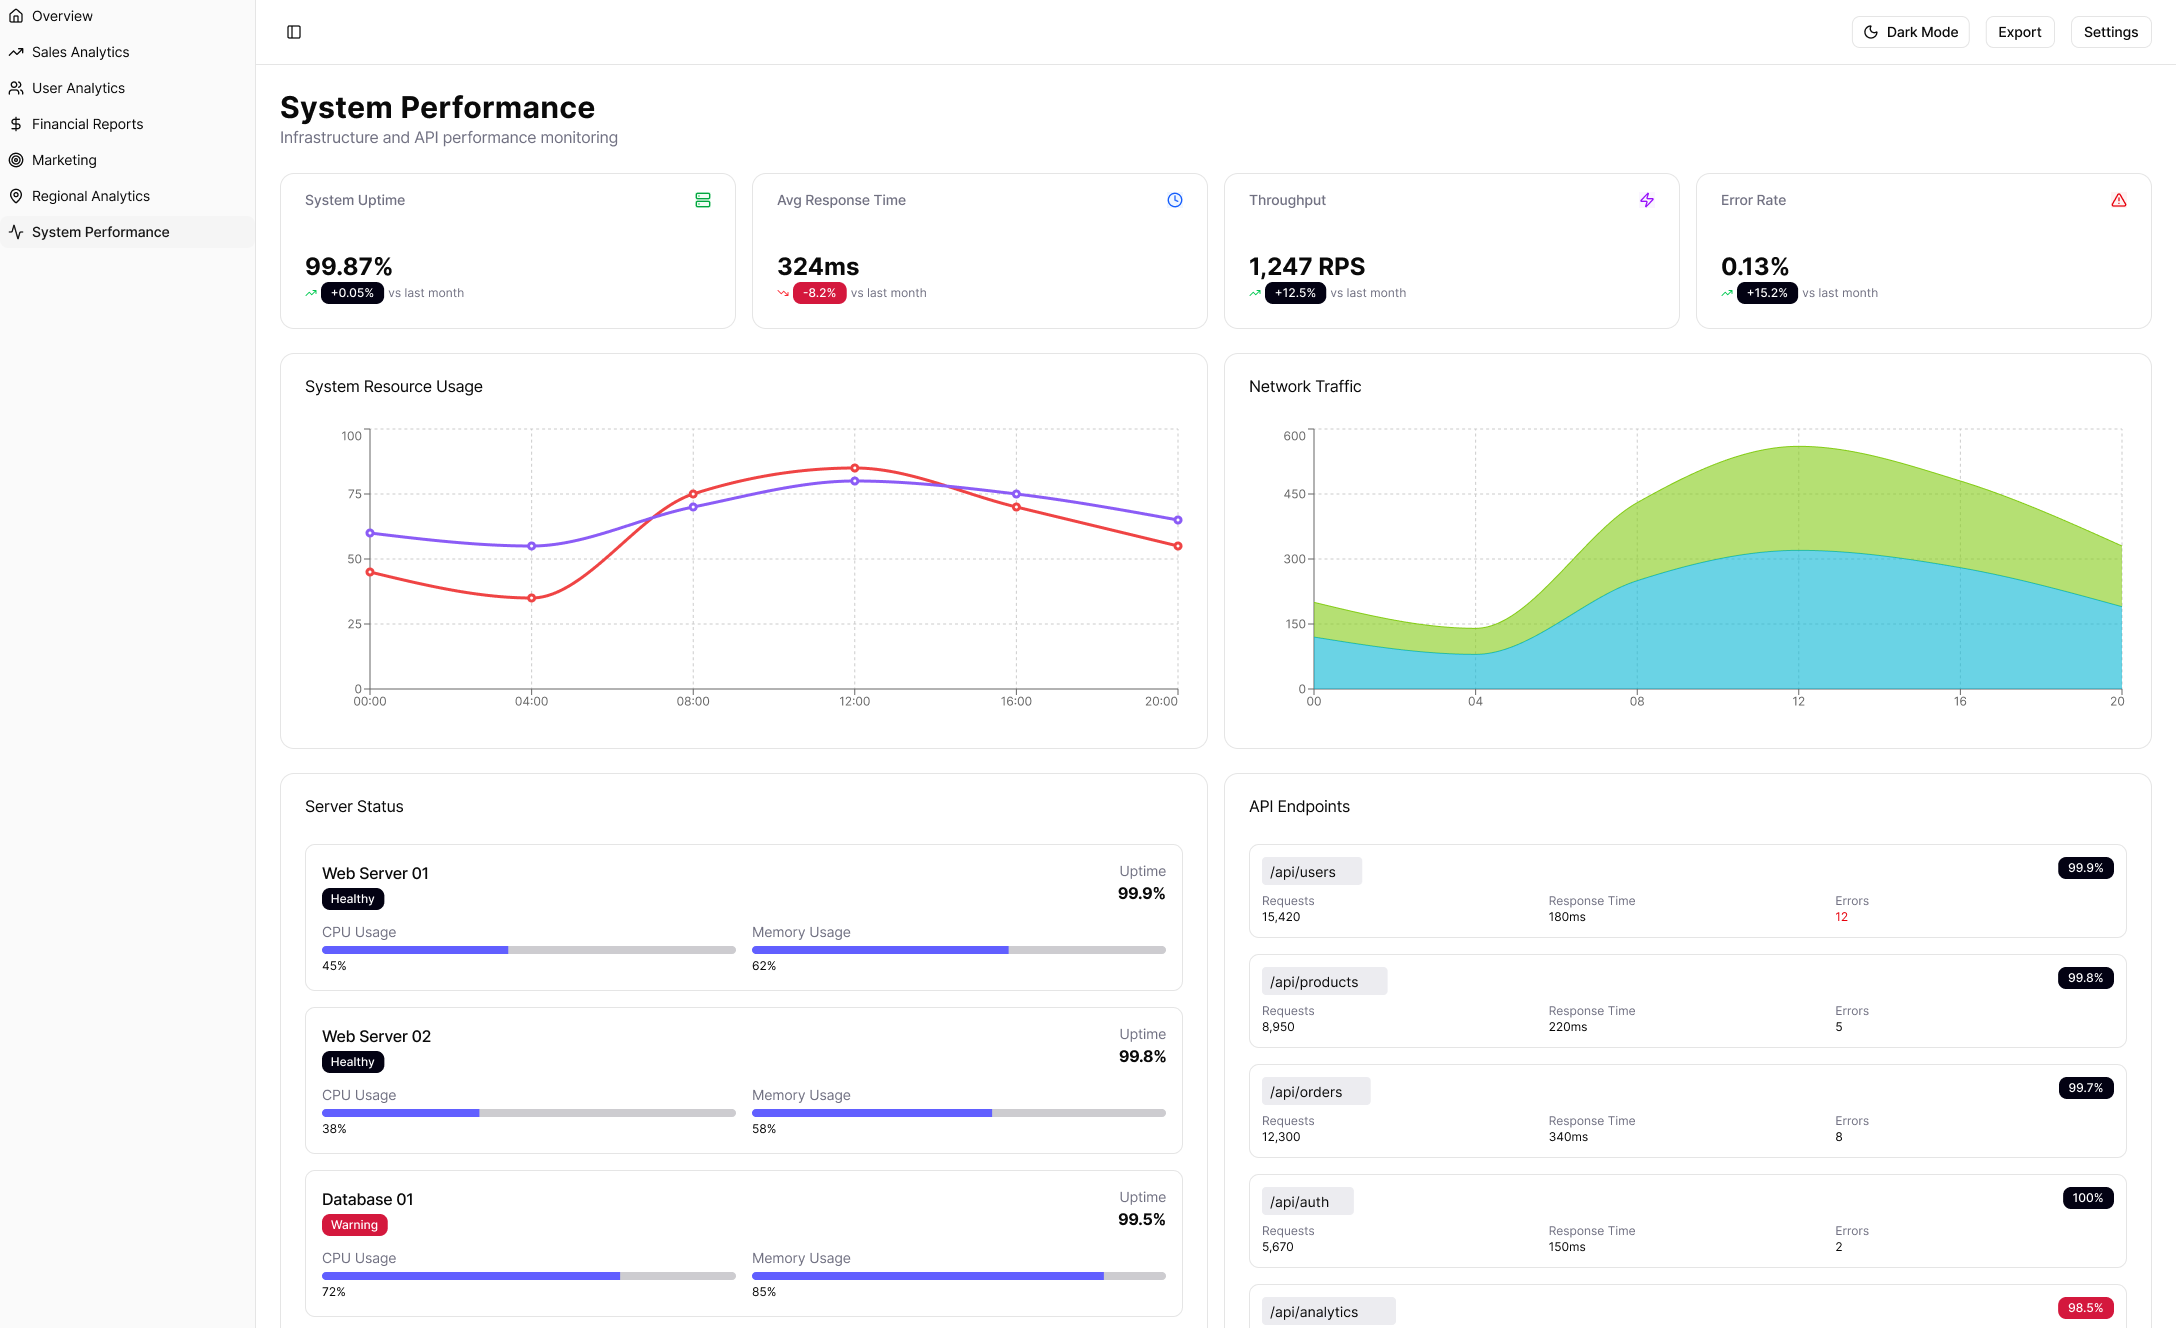
Watch your AI data analyst at work
See how it turns a simple question into a shareable dashboard in minutes
See your AI data analyst in your role
Real questions. Real dashboards. In minutes.
Marketing Manager
“Show me which campaigns drove the most signups this quarter”
Google AnalyticsAirtableBusiness Planning
“Compare revenue by region and highlight month-over-month trends”
BigQueryExcel/CSVCustomer Success
“Build a dashboard showing churn risk by customer segment”
PostgreSQLkintoneBefore your AI data analyst vs. after
What your AI data analyst can do
From raw data to team-wide insights — without a single line of code.
Minutes, not months
Ask a question and get a working dashboard — not a mockup, not a prototype. Your AI data analyst handles data processing, calculations, and visualization in one go.
- •From question to shareable dashboard in minutes
- •No SQL, no formulas, no chart configuration
- •Iterate through conversation, not configuration menus
Understands your business
Your AI data analyst doesn't just take orders — it explores your data, learns your metrics, and builds context from every conversation. The more you work together, the sharper its analysis gets.
- •Explores your data schema and suggests analysis ideas
- •Builds on context from previous conversations
- •Learns your domain-specific terms and KPIs
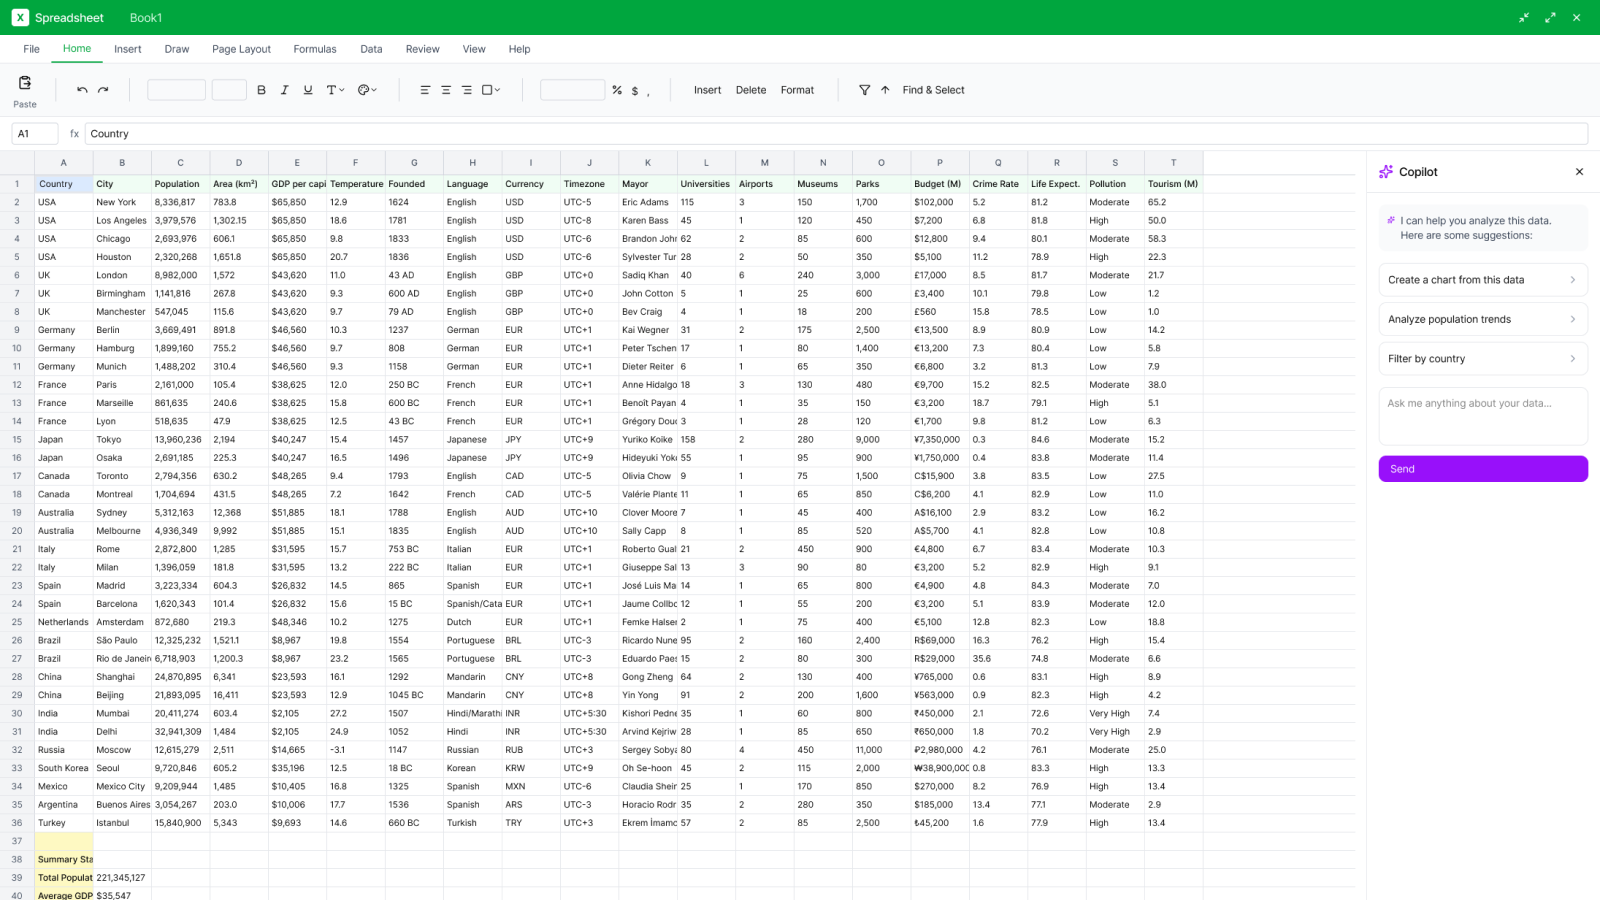
Connects to all your data
Spreadsheets, databases, SaaS tools — your AI data analyst works with the data you already have. Connect multiple sources for a unified view.
- •Excel, CSV, Google Sheets, and Jupyter Notebooks
- •Snowflake, BigQuery, PostgreSQL, MySQL, and more
- •Google Analytics, Kintone, Airtable, and other tools
Spots what you'd miss
Your AI data analyst doesn't wait for questions. It monitors your data, flags anomalies, and surfaces trends — so you catch opportunities and problems before they escalate.
- •Automatically detects anomalies and trend shifts
- •Suggests new analyses based on your data patterns
- •Delivers insights before you think to ask
Share with your whole team — free
Traditional BI charges per viewer. Squadbase doesn't. Invite your entire company to view dashboards at no extra cost — because insights shouldn't be gated by license fees.
- •Unlimited viewers at no cost
- •One-click publishing with built-in authentication
- •Viewers can become creators anytime
Adapts as your data evolves
Business changes. Data structures change. Your AI data analyst adjusts dashboards through conversation — no rebuilding from scratch when requirements shift.
- •Tell the AI what changed, it updates the dashboard
- •Refine analysis as your understanding deepens
- •Built-in version history to compare iterations
Your AI data analyst, built on trust
SOC2 Type 1 Certified
Your AI data analyst operates under industry-standard security certification — your data stays protected
Scales with your team
Infrastructure that grows automatically as your team and dashboards expand
Full activity tracking
Every action your AI data analyst takes is logged with comprehensive audit trails
Secure from day one
Built-in authentication ensures only authorized team members access your dashboards
What teams are saying
Hear from teams using their AI data analyst every day.
“We couldn't see our purchasing lead times or dead stock, so decisions came down to gut feel. Just by importing CSVs into Squadbase, the dashboards took shape, and as the data accumulated, we were able to build a genuinely healthy cash-flow management practice.”
Shingo Kuroyanagi
Head of E-commerce Strategy
LUCA
“When fluctuations appear in our monitoring metrics, we can intuitively expand our analysis using natural language — no time spent writing queries. It enables rapid root cause investigation and has become a foundation for our continuous improvement cycle.”
Atsushi Nakabayashi
meviyLab Chief Director
Misumi
“Updating our fan-facing data visualization pages used to require designers and engineers, which made every change a major effort. With Squadbase, I just describe what I want and a dashboard takes shape — even as a non-engineer, I can now test ideas instantly.”
Naohide Hatama
Content Director
SHIBUYA CITY FC
“The BI tool from another vendor that we previously used required specialized knowledge to set up and manage dashboards. With Squadbase, we can quickly create dashboards using generative AI, making it easier to leverage data for everyday decision-making.”
SokuSapo Business Unit — Business Unit Head
W&B Consulting
“What used to be a multi-step manual transfer from WixStore to spreadsheets now happens in a single screen with Squadbase. The biggest strength is being able to add features just by typing a request into the chat, so the system keeps evolving with our team's needs.”
Masato Fukutomi
E-Commerce Staff
PLAYNEW
“We used to spend enormous time on manual checks every month, but AI-powered automated matching has dramatically reduced our workload. Inconsistencies between staff members have been eliminated — it's a highly practical tool that achieves both efficiency and quality.”
Mayumi Hirano
Sales Department, General Manager
Meihoku Social Insurance Labor Consulting
“Squadbase made it genuinely easy to build applications on top of Snowflake. The setup was straightforward, and we were able to move from our data to a working app quickly without any unnecessary friction.”
Matt Hubbard
Executive Vice President
Cygnal
Add an AI data analyst to your team
Start free. Your first dashboard in minutes.
Free Plan
Perfect for individuals and small projects to explore Squadbase's capabilities.
Features
- Up to 5 projects
- 1 creator seat
- 5 Publish total
- Squadbase DB (up to 0.5GB)
Pro Plan
Built for teams and production applications that need scale and advanced features.
Features
- Everything in Free Plan
- Unlimited viewer seats
- Unlimited Projects
- Unlimited Publish
- Squadbase DB (5GB free, then $3/GiB/month)
Team Plan
For growing teams that need project-level permissions and higher capacity.
Features
- Everything in Pro
- Project-based role management (Creator / Viewer)
- Squadbase DB (up to 10GB, then $3/month)
- Audit log
- Custom Domain
Enterprise Plan
Tailored for large organizations with custom requirements and dedicated support.
Features
- Everything in Pro
- SAML/SSO integration
- Private network integration
- IP restrictions
- Server region lock
- Dedicated support
No credit card required.
Frequently Asked Questions
Getting Started
Squadbase AI is an AI data analyst that joins your team. Just describe the insights you need, and it handles everything — from data connections to dashboard creation to sharing with your team.
No — just describe what you need in plain words. Squadbase AI handles the data processing and visualization, and you can review and refine the results.
Yes. Just upload your Excel or CSV file, and Squadbase AI reads the data and builds a dashboard. You can share it with your team right away.
You can specify metrics, filters, chart types, and more. Everything Squadbase AI creates is fully visible and editable.
Yes — import your existing analysis logic and work with Squadbase AI to build on it. Great for gradual migration.
Data & Security
Squadbase AI connects to spreadsheets (Excel, Google Sheets), databases (Snowflake, BigQuery, and more), and business tools (Salesforce, Google Analytics, and others).
You can set view and edit permissions for each team member. Sharing can be restricted to invited members only.
Yes. All processing by Squadbase AI runs in isolated, secure environments — protected per user.
Squadbase AI Quality
Squadbase AI shows all its work. Instead of a black box, you can see and edit every chart and calculation — so you can trust the results because you verified them yourself.
Squadbase AI presents its work step by step, so you can review and adjust along the way. You verify not just the final result, but the process behind it.
Yes. Squadbase AI handles datasets with millions of rows, automatically choosing efficient processing methods based on data size.
Team Sharing
Yes — dashboards Squadbase AI creates are ready to share instantly. Adding viewers is free, and you can set detailed access permissions.
Yes. Viewers are free so your whole team can access dashboards. Our pricing is designed to encourage team-wide adoption.
After Squadbase AI builds a dashboard, share it with your team in one click. No file hand-offs needed.
Every change Squadbase AI makes is tracked, and you can roll back to any previous version. Experiment with confidence.
Switching to Squadbase
Start by running them side by side. Hand your slow-to-update dashboards to Squadbase AI first, then shift over time.
Pricing
Creator seats — for those who build dashboards with Squadbase AI — are paid. Team members who view dashboards are free. Creator seats start at $35/month (Pro plan). You can start with our free plan to try it out.
Yes — start with one creator and a few viewers, then expand as your team grows.
Security & Governance
Squadbase AI operates with minimal permissions in isolated environments. Access controls and audit logs let you track who accessed what at all times. Data is stored in AWS (Tokyo region), encrypted at rest and in transit. We are SOC 2 Type 1 certified.
Just tell Squadbase AI about the changes, and it quickly adjusts your dashboards. It adapts flexibly to evolving data.
Getting Results
A revenue dashboard from Excel or CSV is a great start. Squadbase AI builds it in minutes, and sharing it with your team naturally drives adoption.
Teams that have reverted to Excel because their current BI tool is too slow to update. Once they experience how fast Squadbase AI builds dashboards, adoption spreads naturally.