Quick Start
Learn how to create an interactive dashboard in just a few minutes using an Excel file
With Squadbase, you can turn your Excel file into an interactive dashboard in just a few minutes. This guide walks you through every step from creating your first dashboard to sharing it with your team — even if it's your first time using Squadbase.
Time Required
About 10 minutes
What You Need
- A Squadbase account (free sign-up available)
- An Excel file to analyze (.xlsx, .xls, or .csv format)
If you don't have an Excel file handy, download our sample file to get started.
Create Your First Dashboard
-
Log in to Squadbase and click the +New button from the Spaces > Projects screen
-
Select the Excel/CSV icon from the data source selection screen and upload your file
-
Squadbase AI will begin analyzing your uploaded data
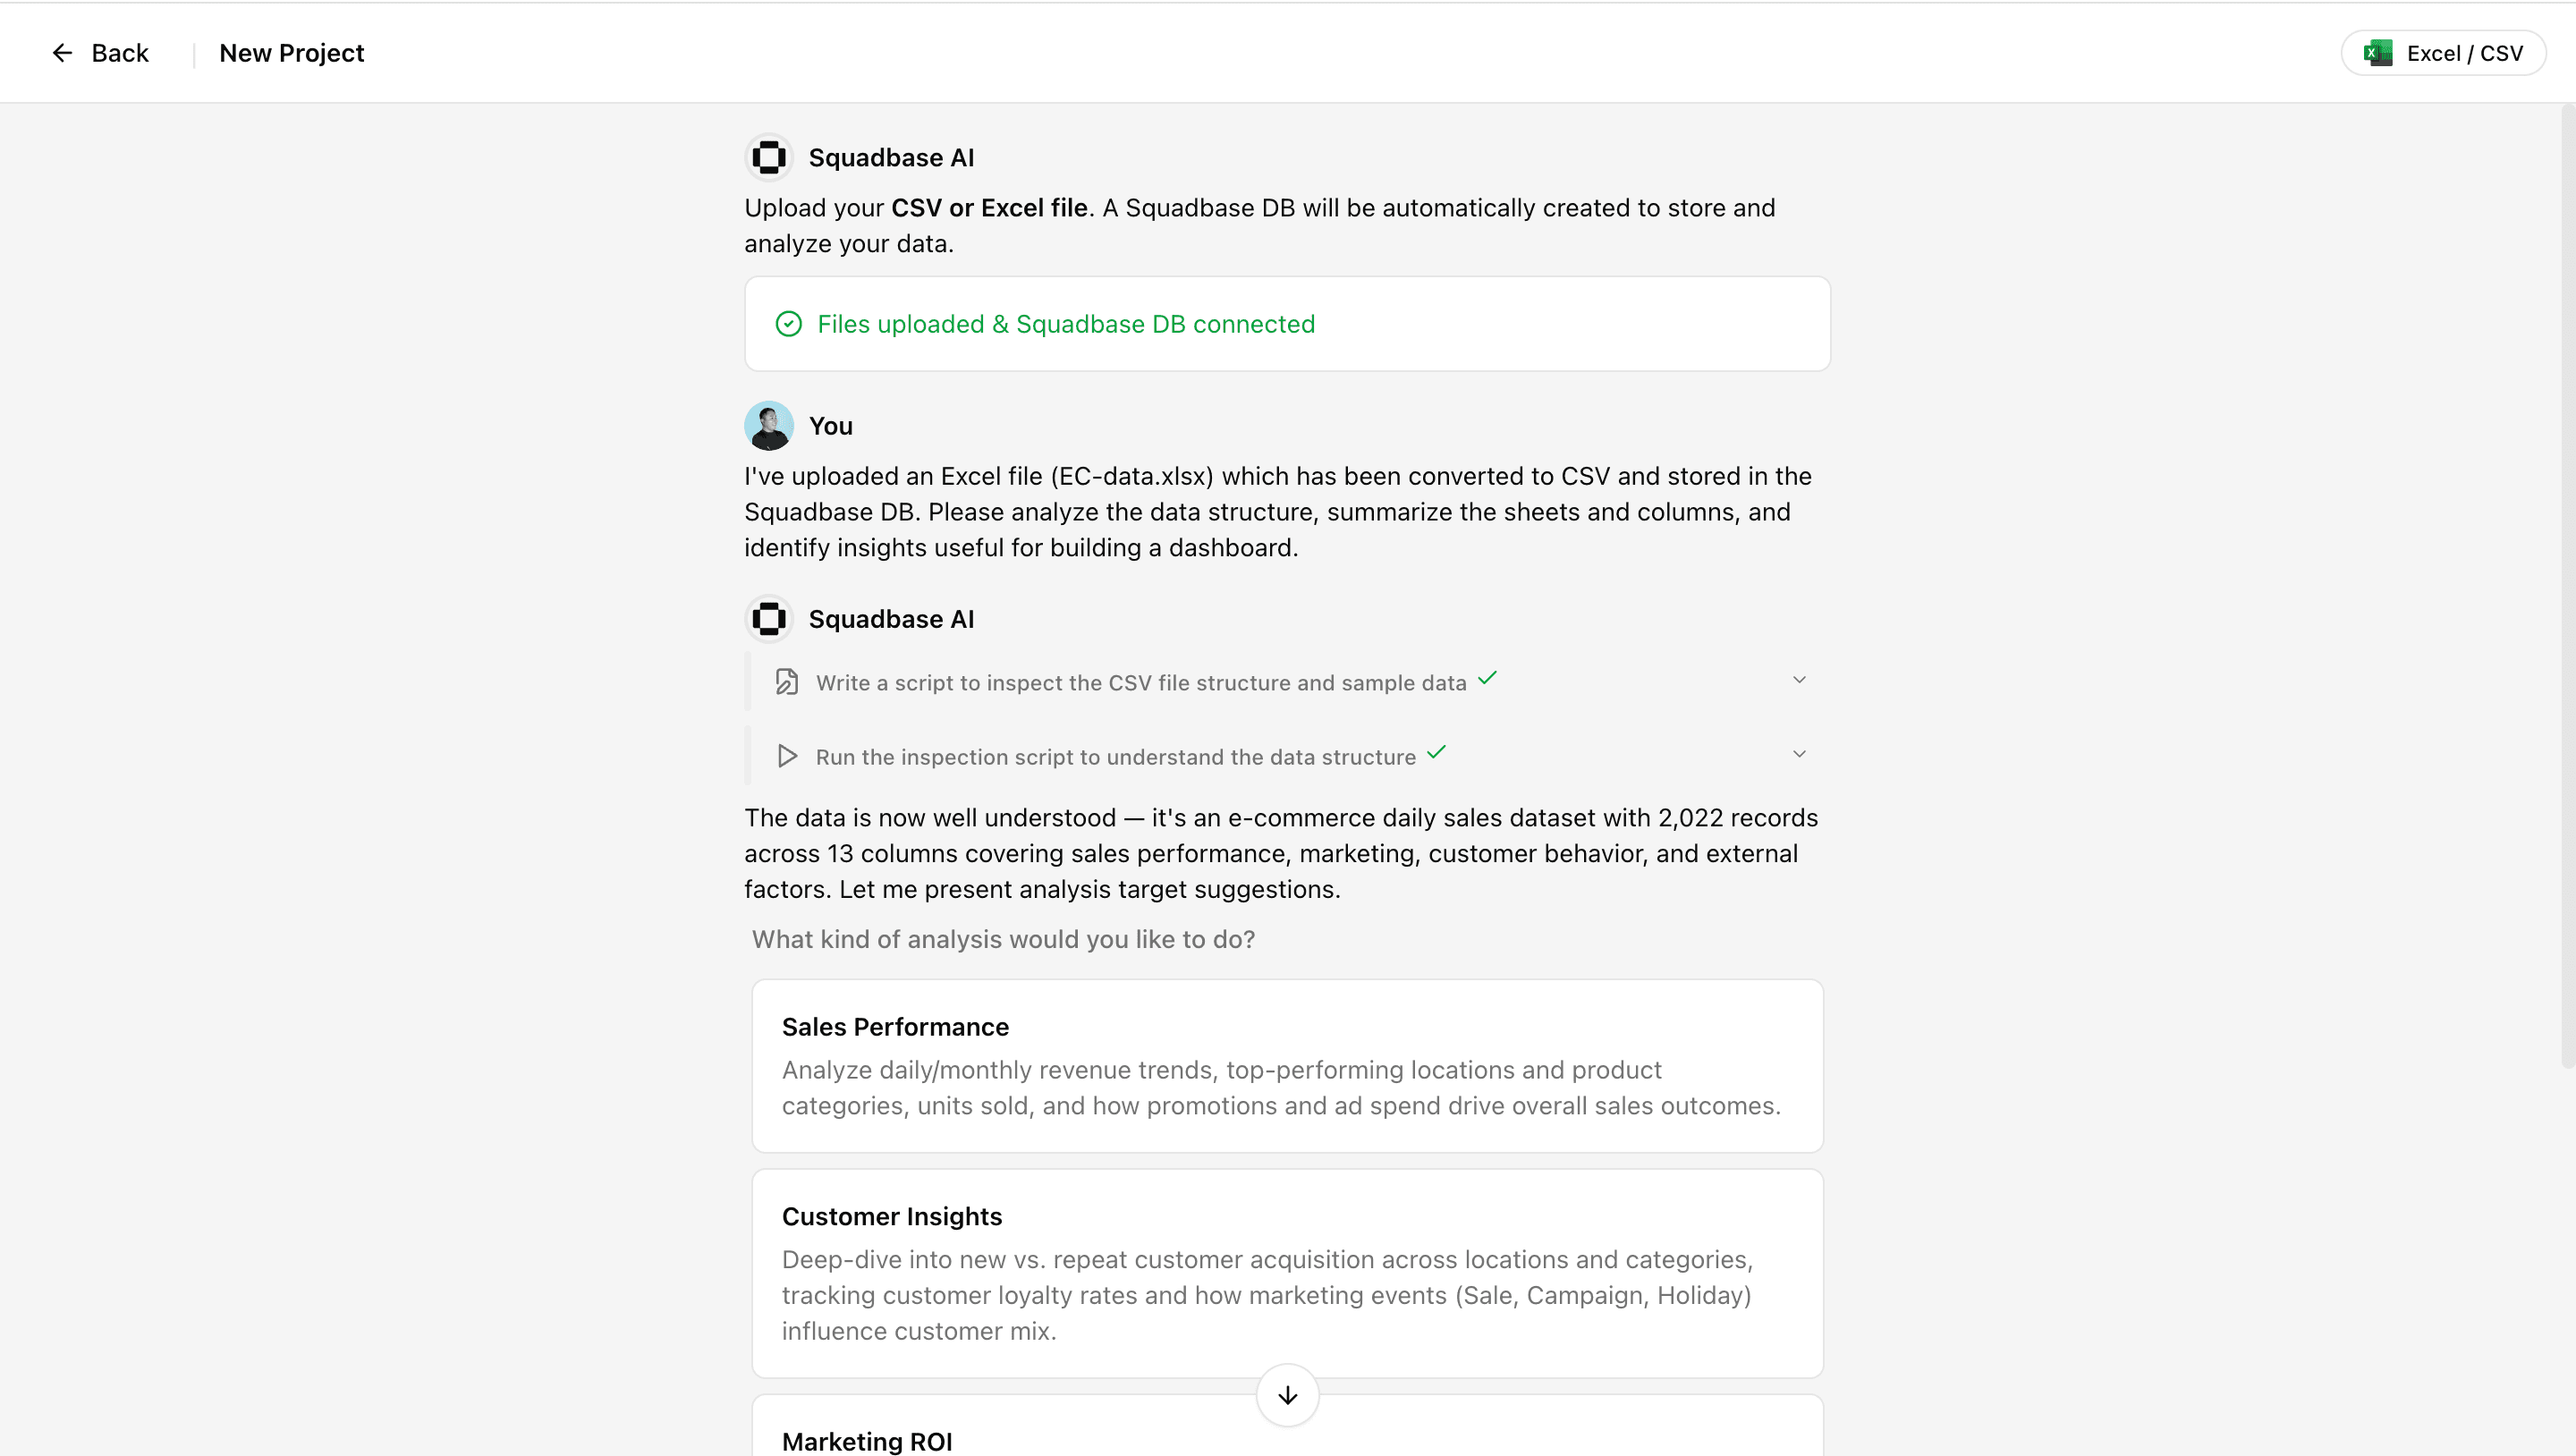
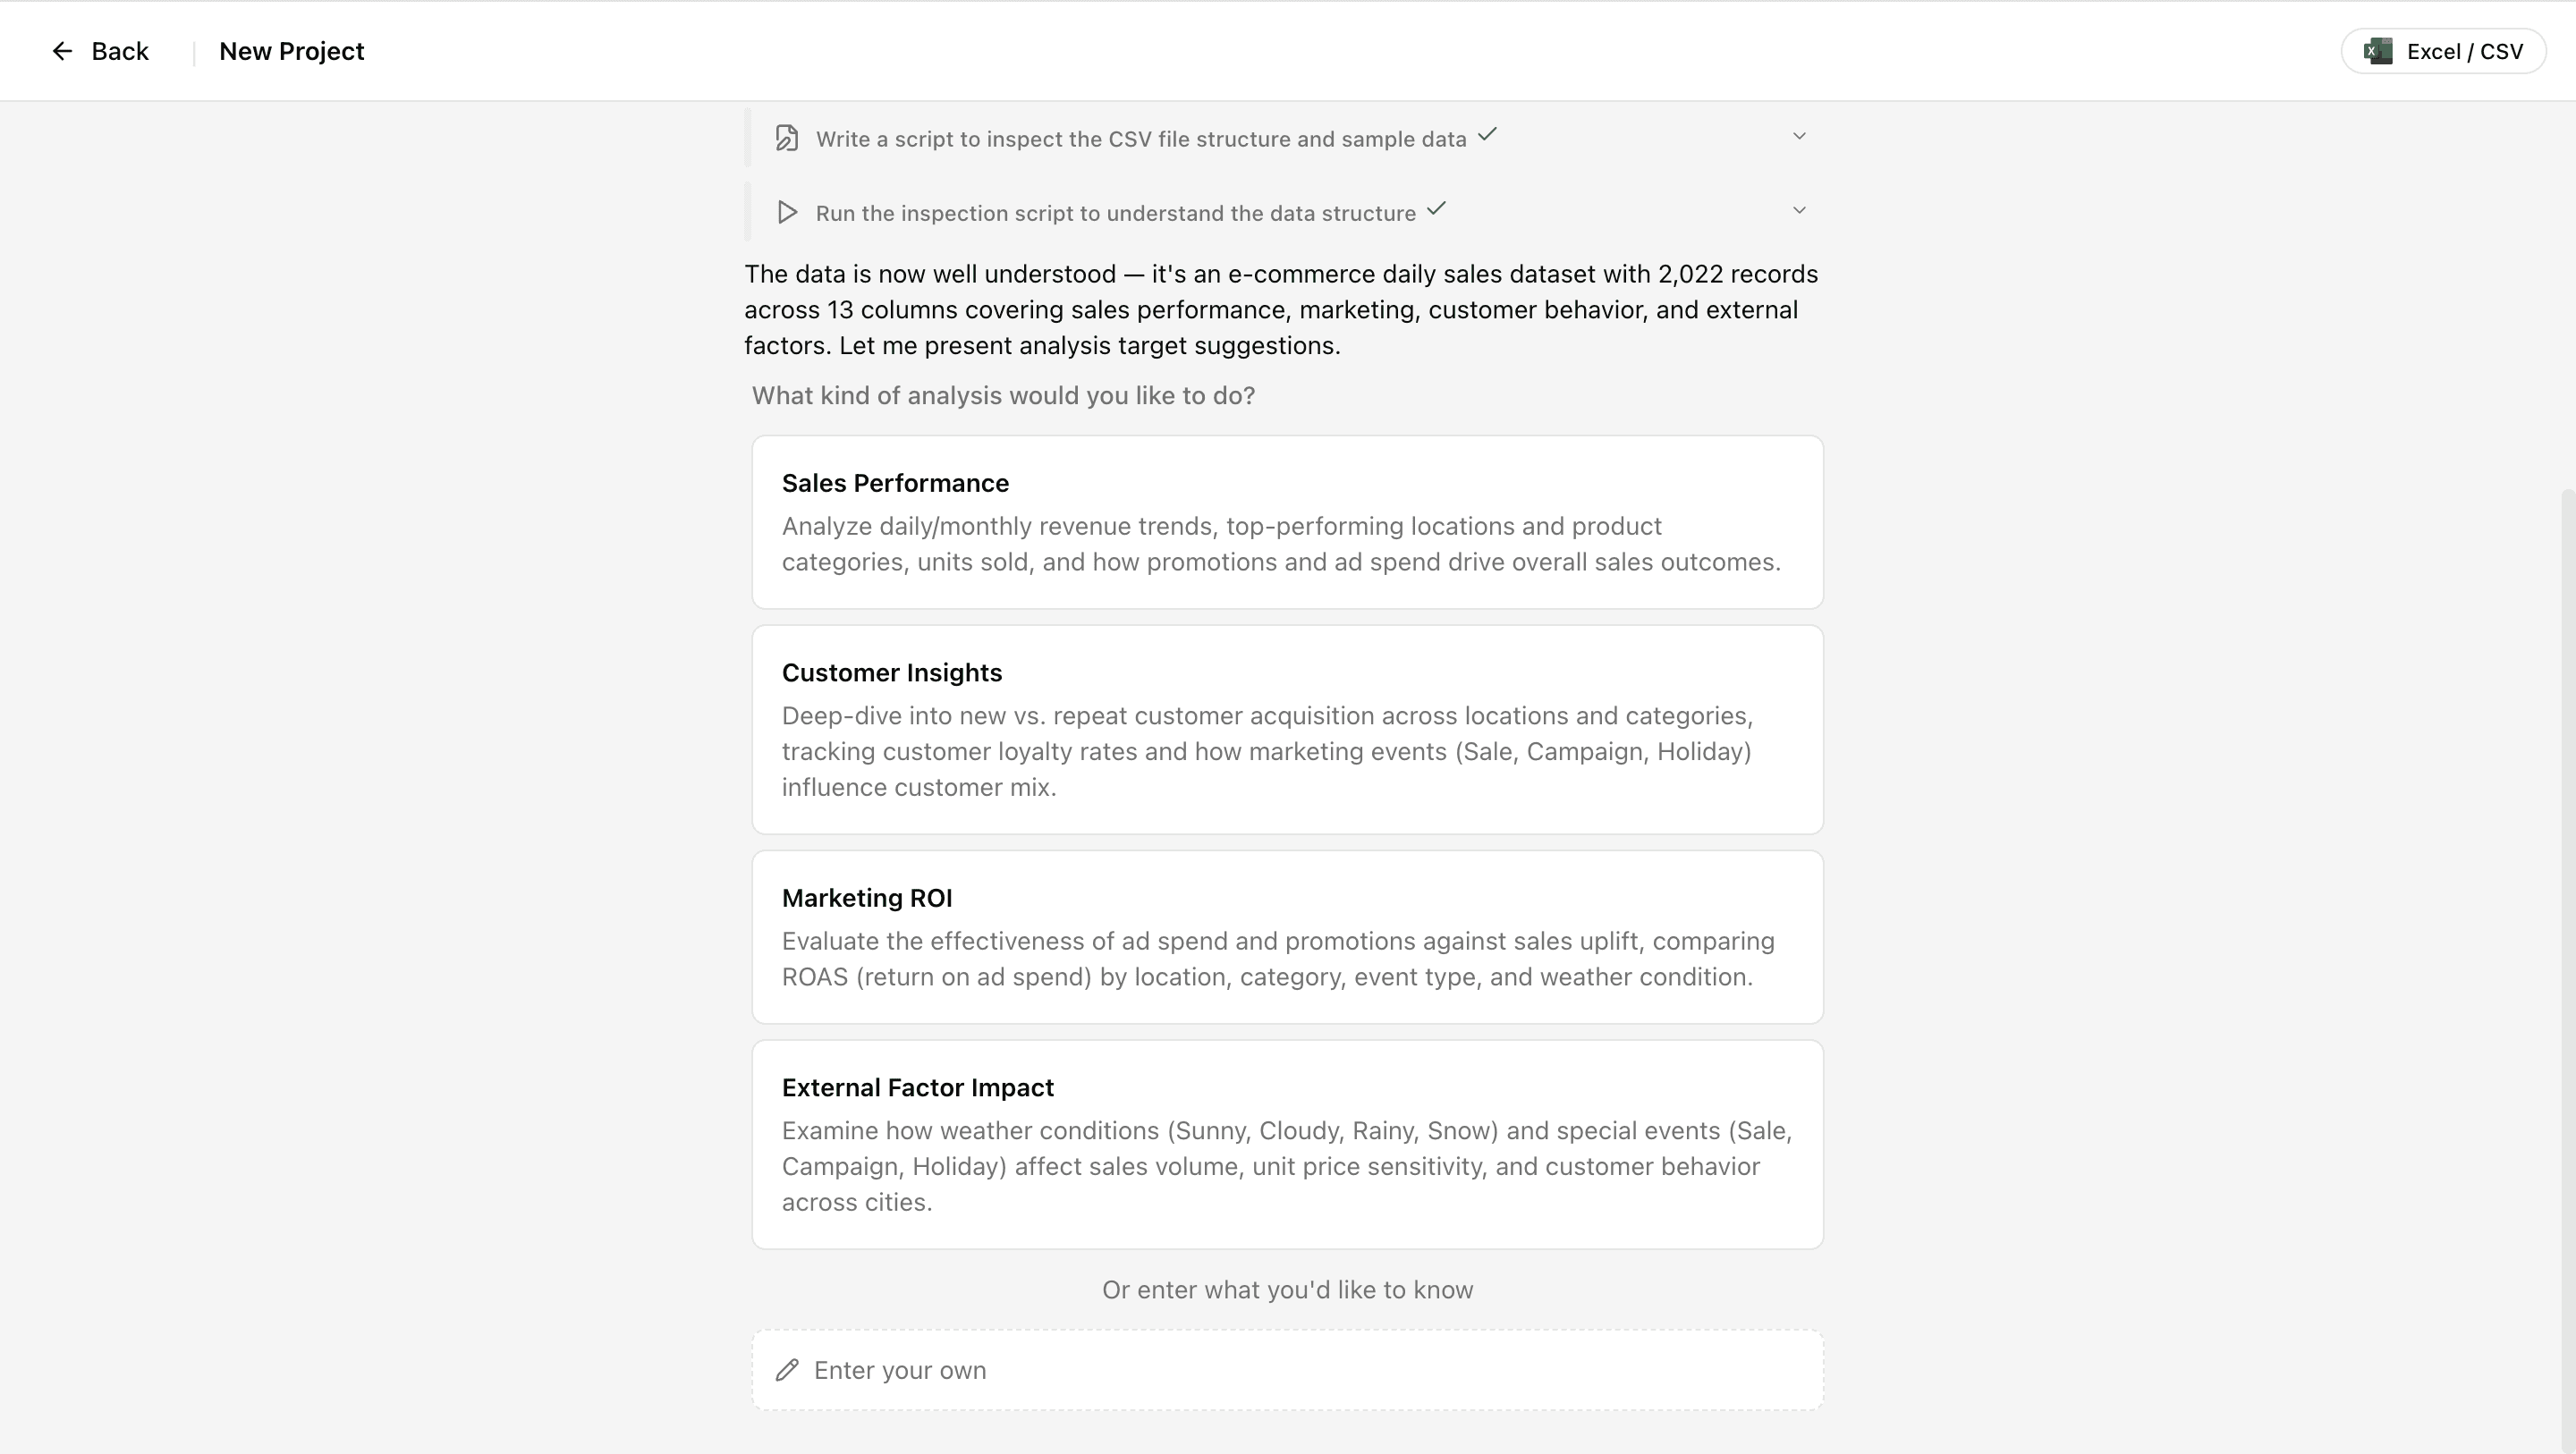
-
Once analysis is complete, AI will suggest analysis options based on your data. Select one, or type your own instructions if you have something specific in mind
-
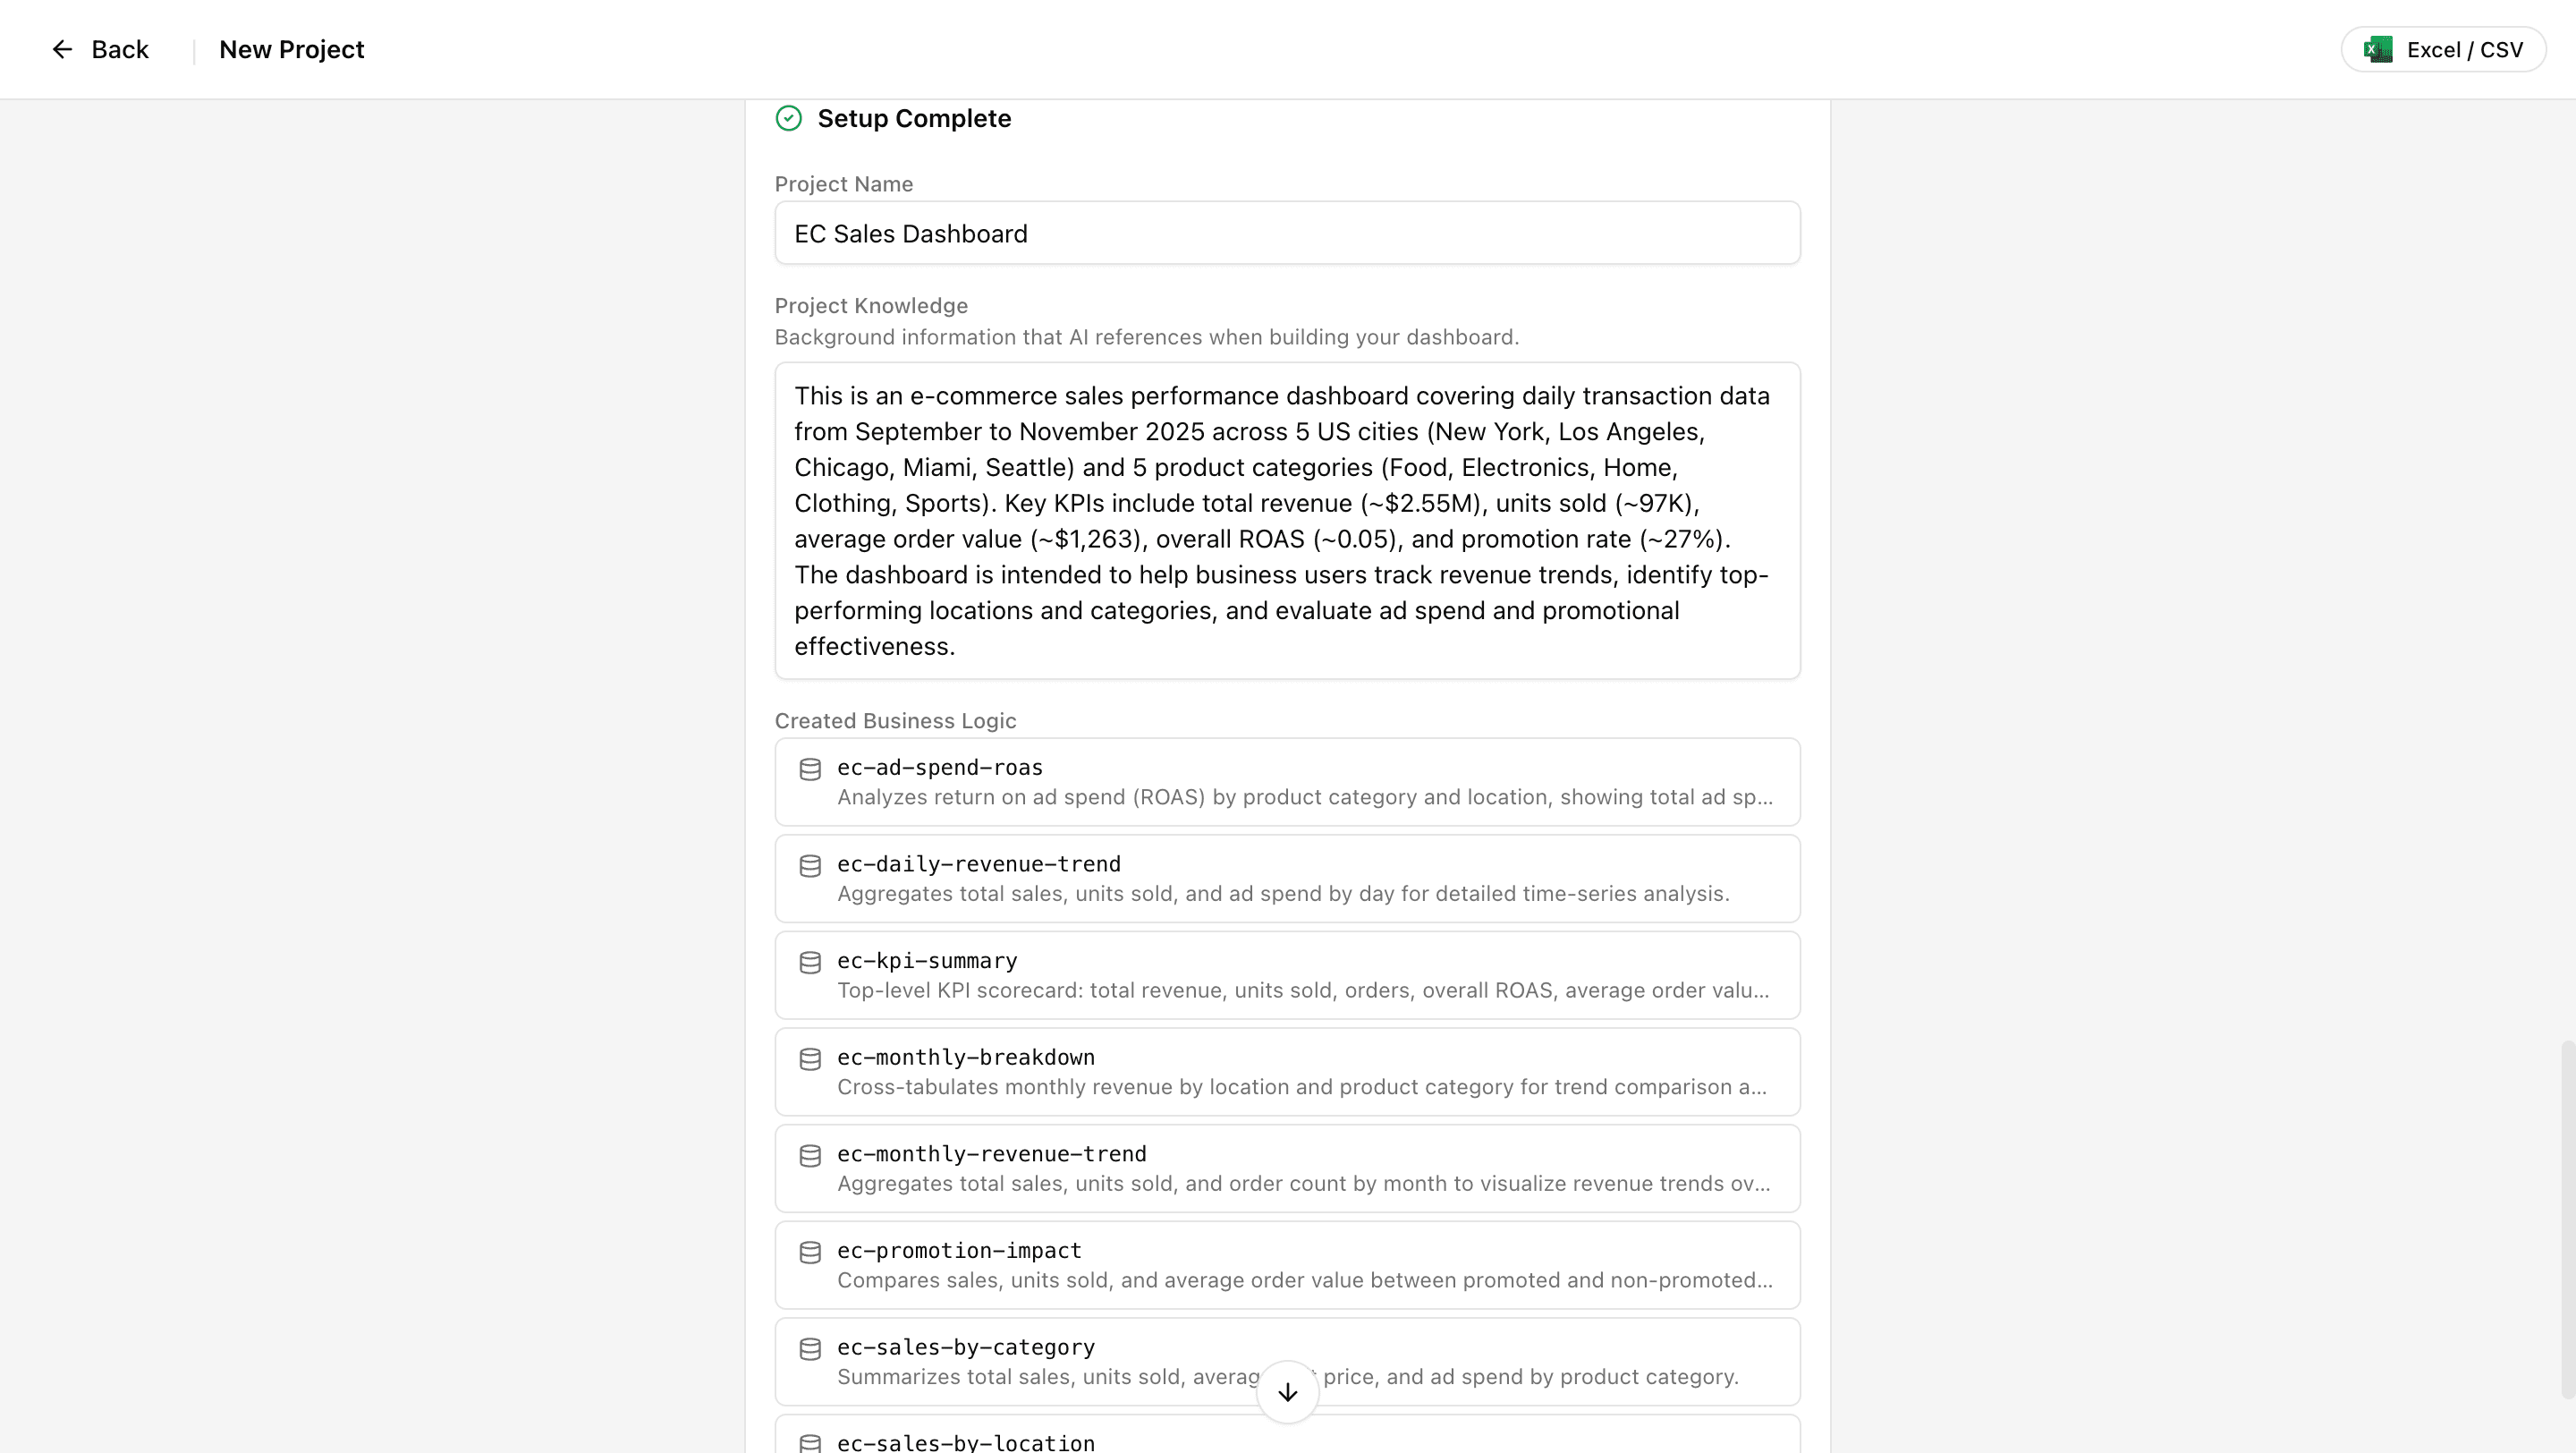
After selecting or entering your instructions, Squadbase AI creates the following:
- Project name
- Project Knowledge — background knowledge the AI references when building dashboards
- Business Logic — query and function definitions the AI prioritizes for data analysis and dashboard creation
-
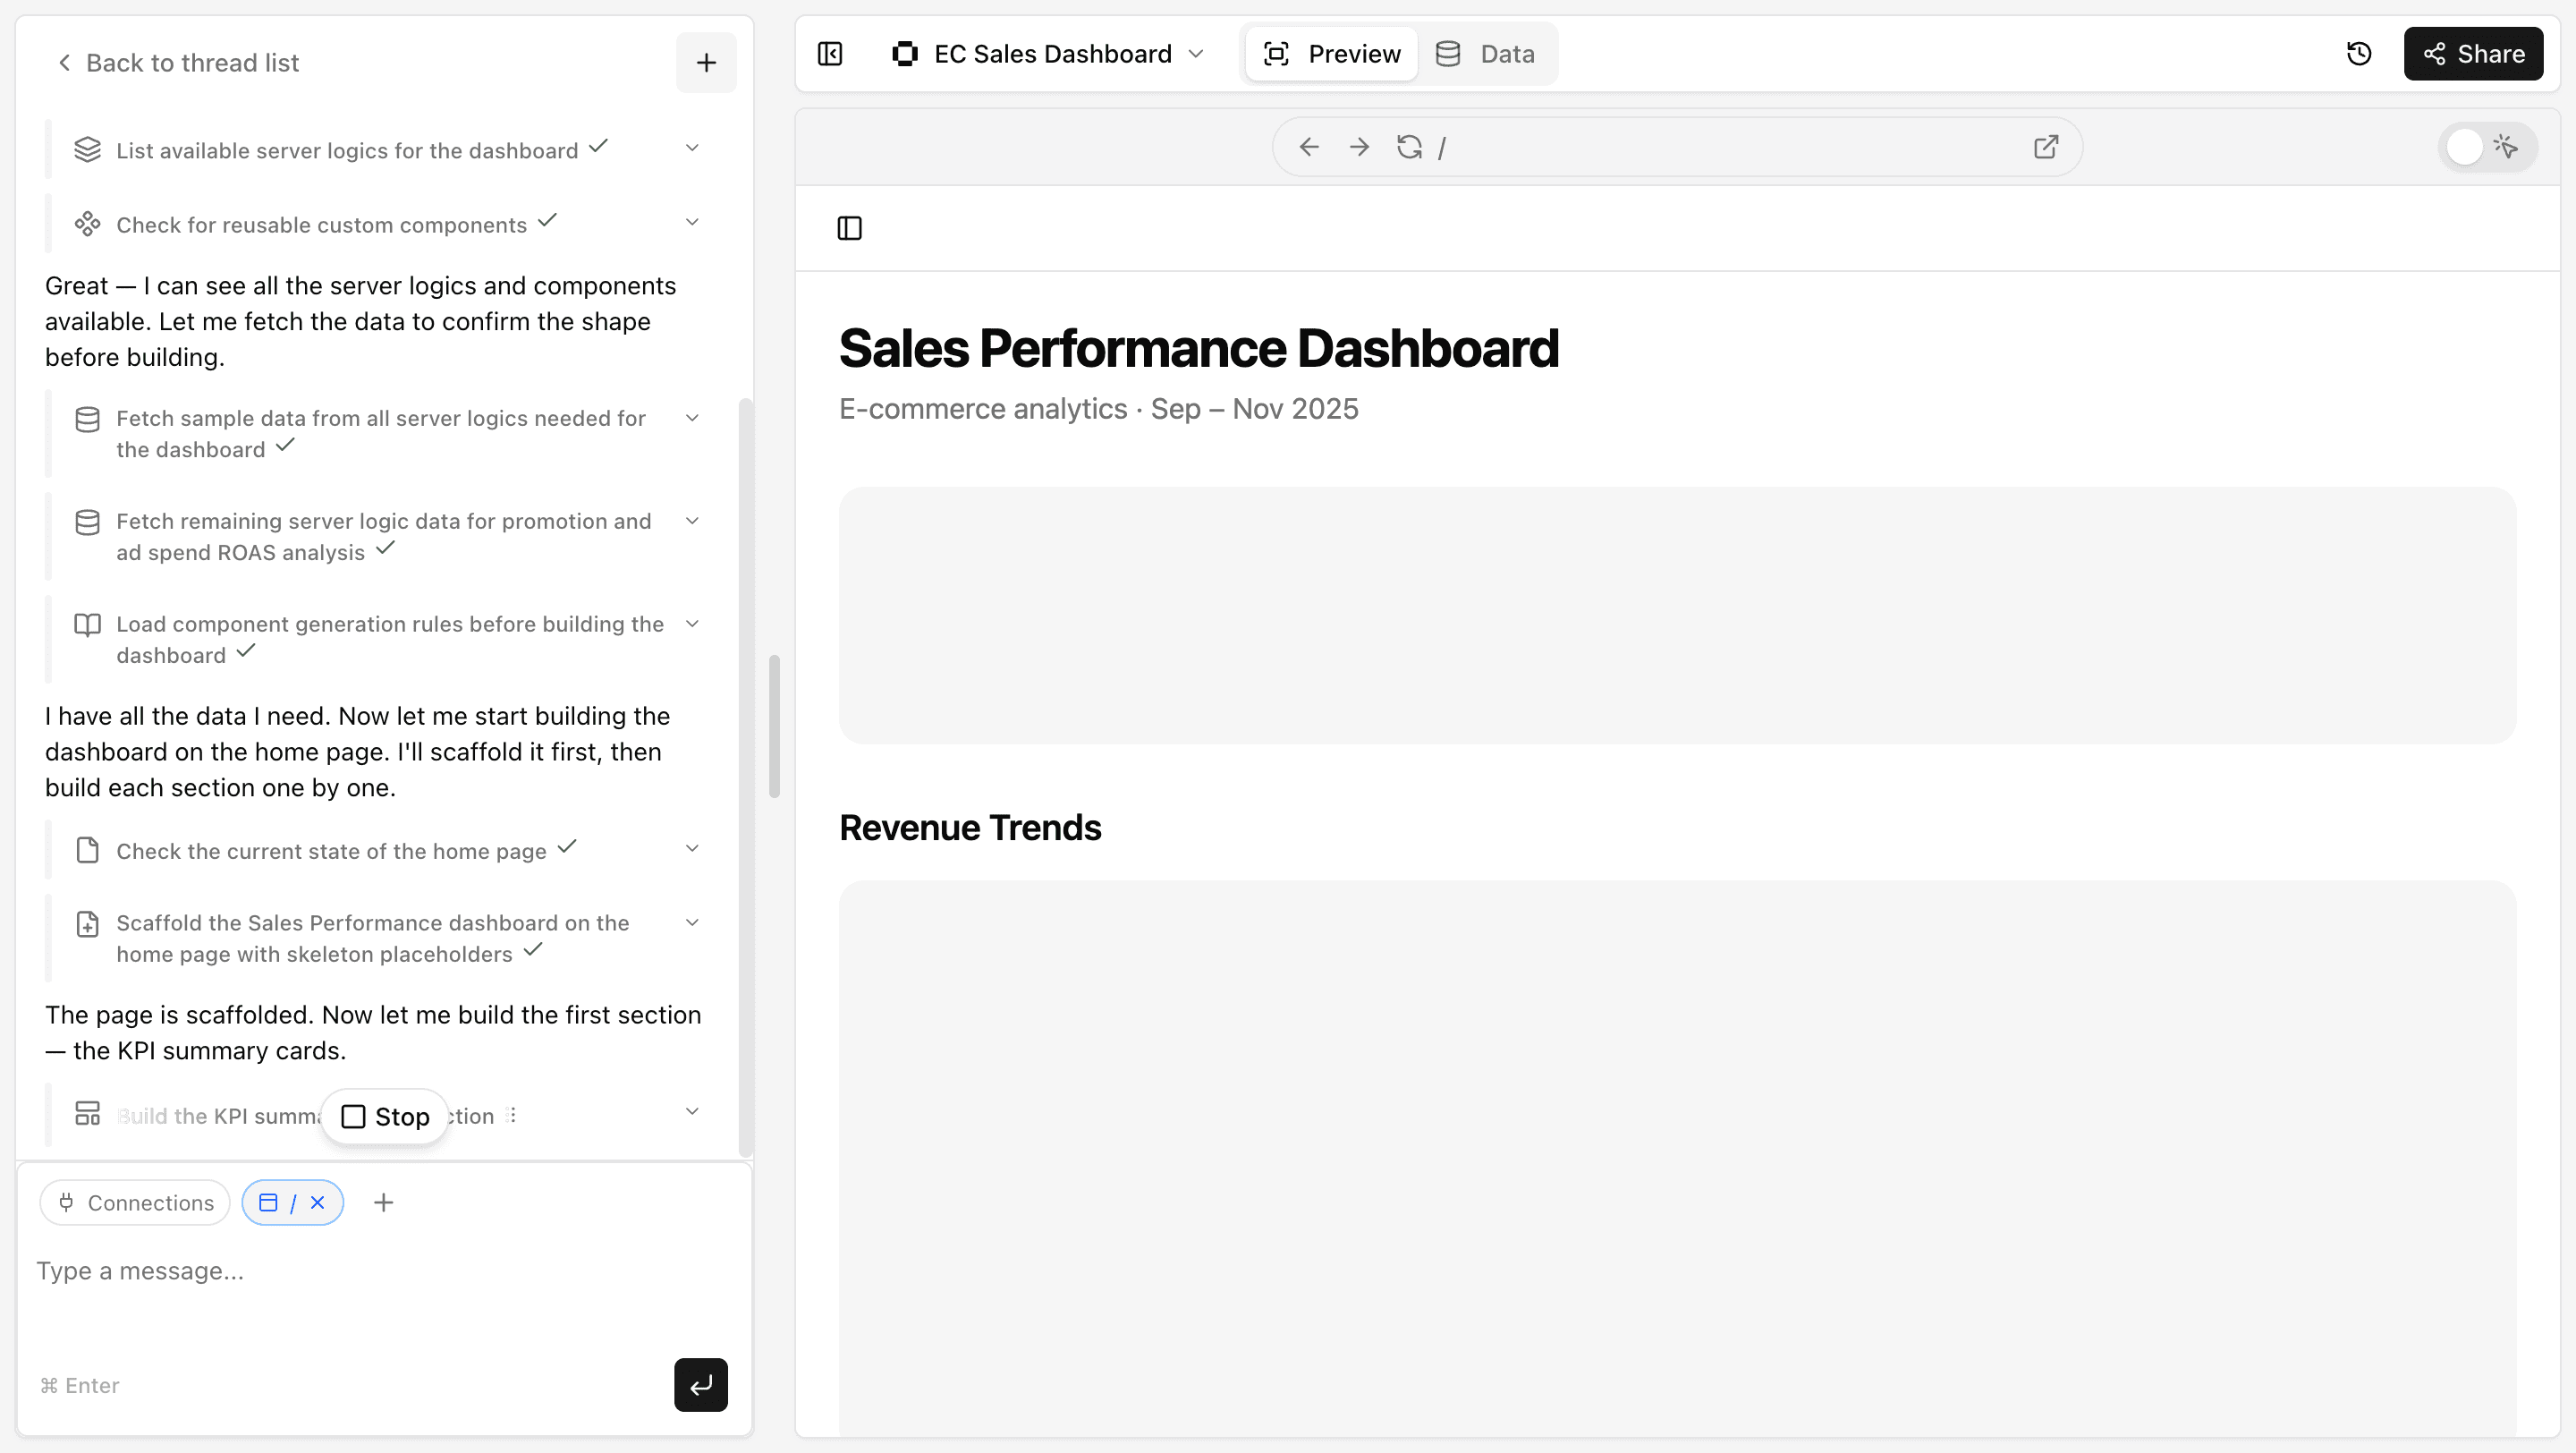
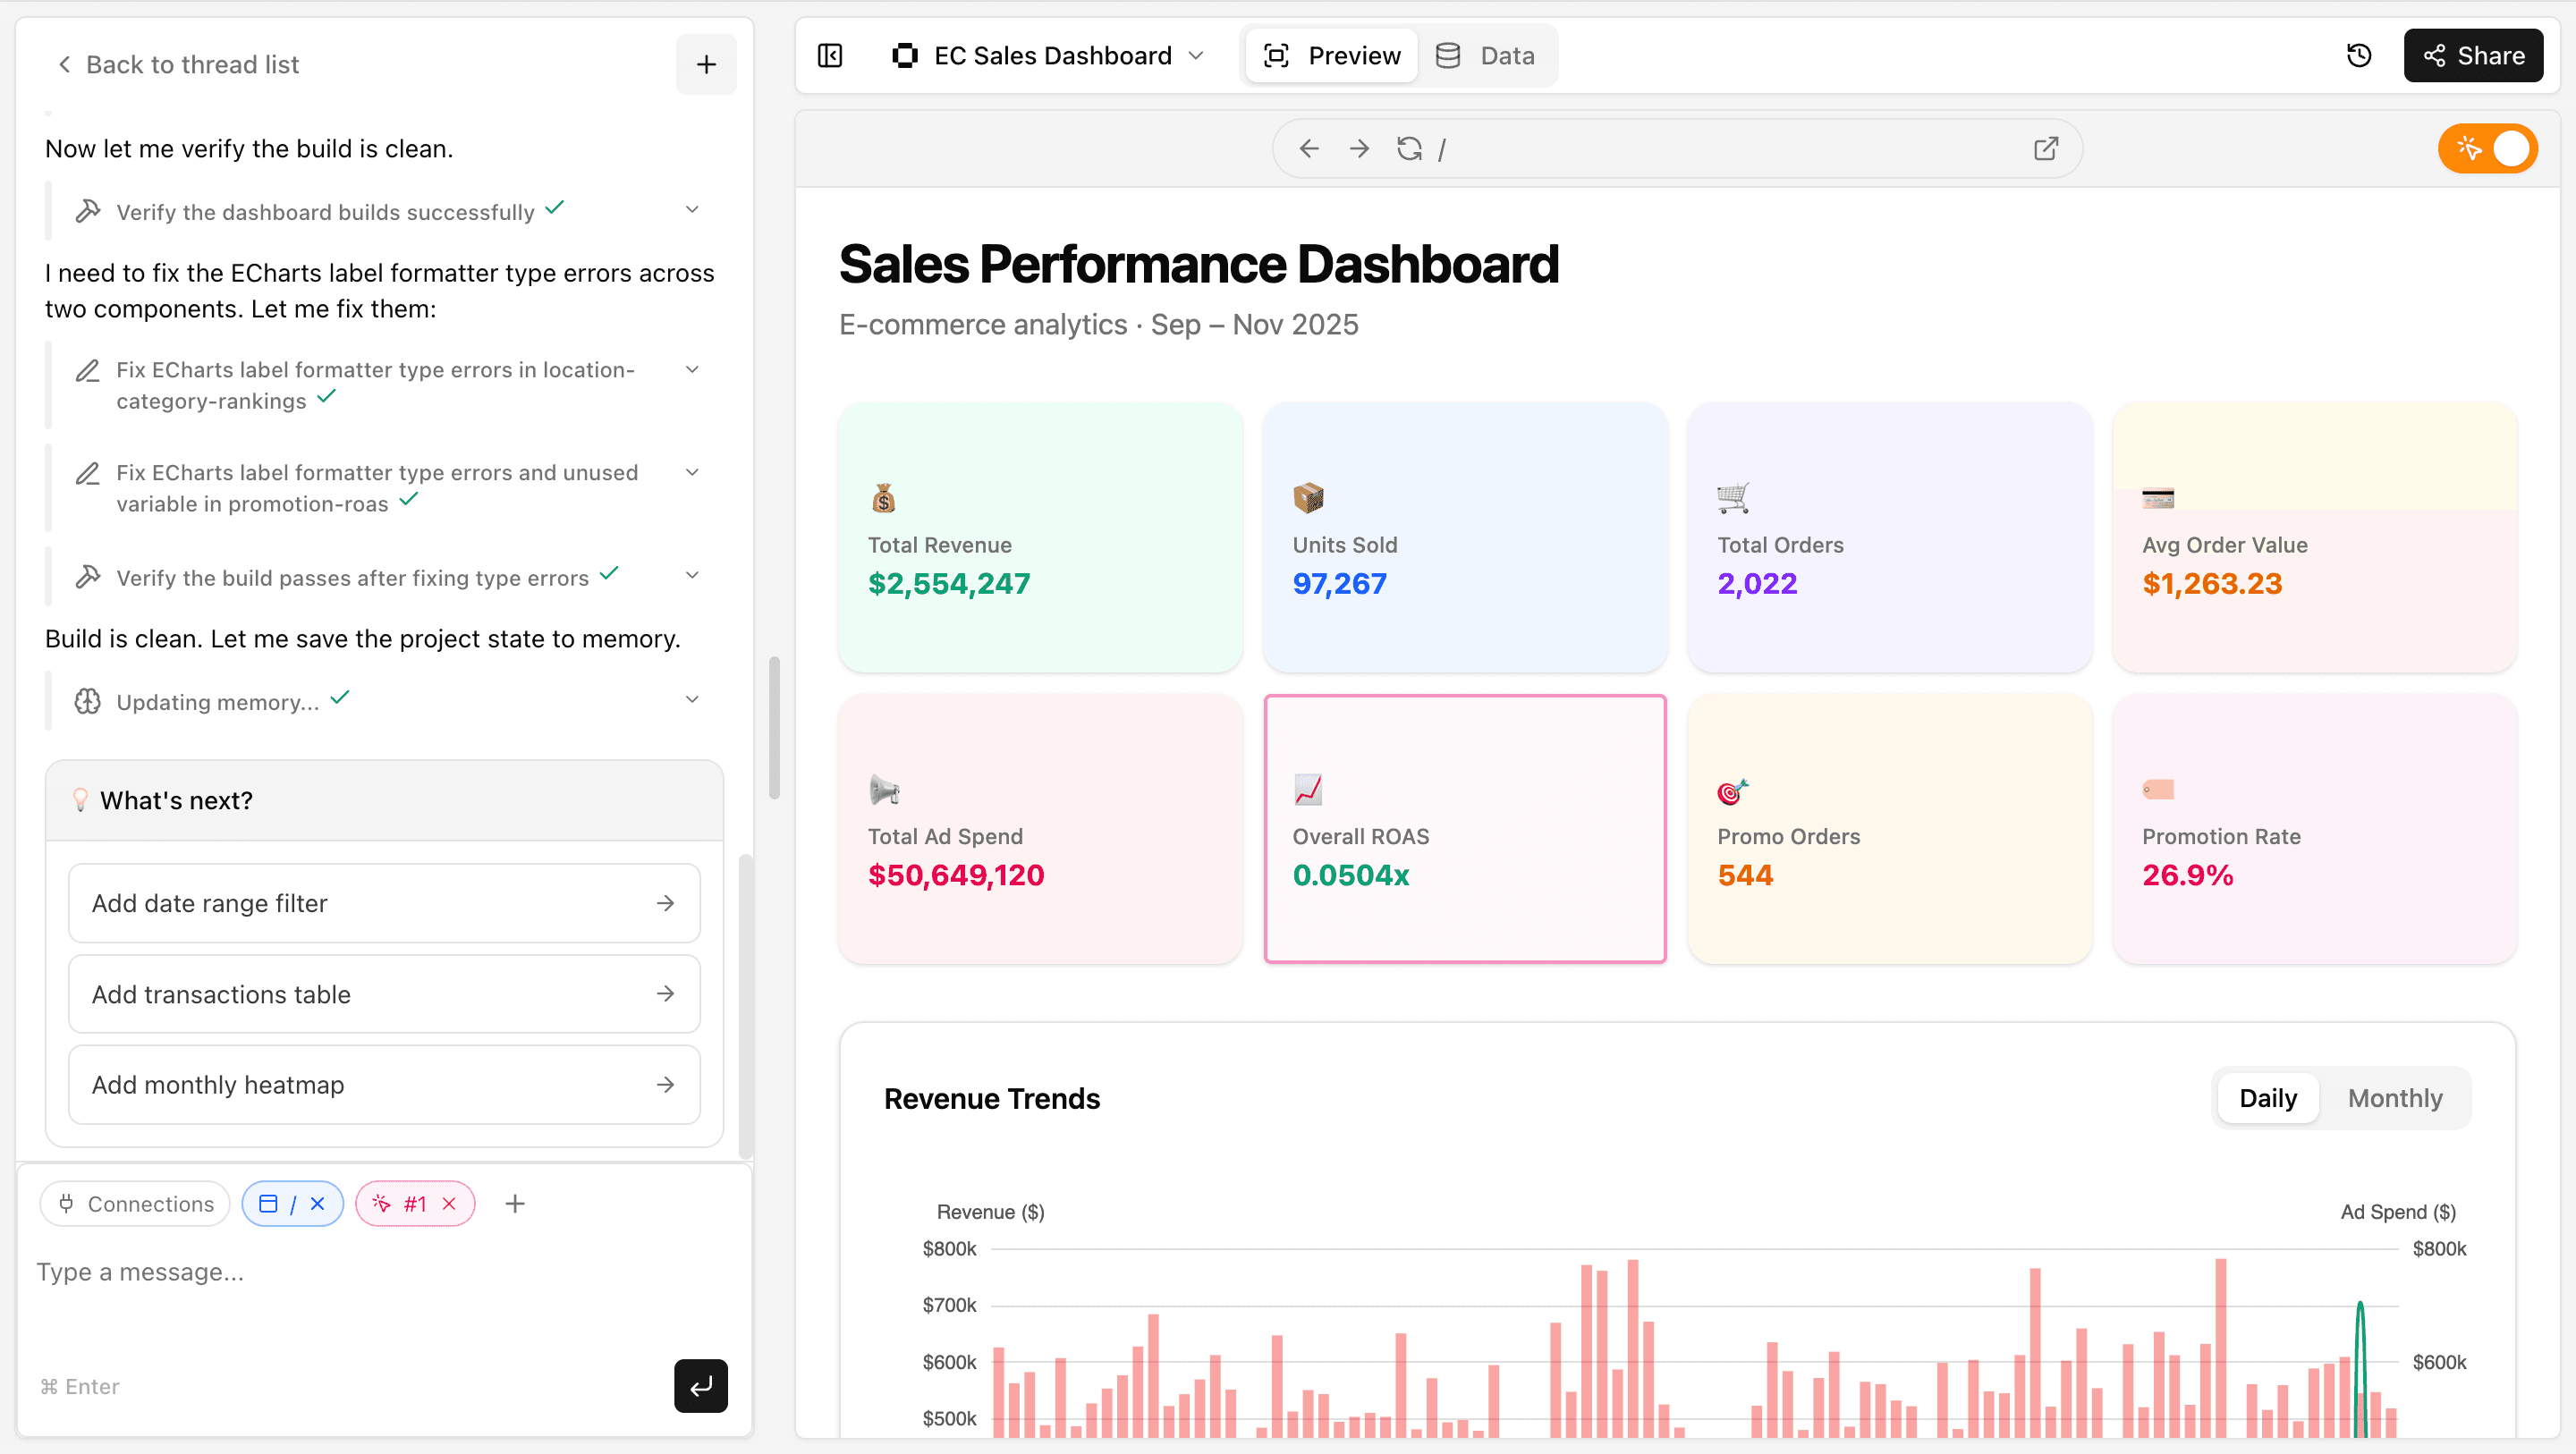
Click "Build Dashboard in Editor" to enter the editor. The editor shows a chat panel on the left and a dashboard preview on the right, so you can see results immediately.
-
Wait a moment for AI to finish — your dashboard will be ready.

Refine Your Dashboard
The AI-generated dashboard can be improved as many times as you like through continued conversation.
Examples:
Change the graph colors to shades of blueSet the title to "FY2026 Sales Summary"Add a filter for year and monthTo adjust a specific element, turn on element selection mode in the top-right of the preview panel to target your instructions to a single component.
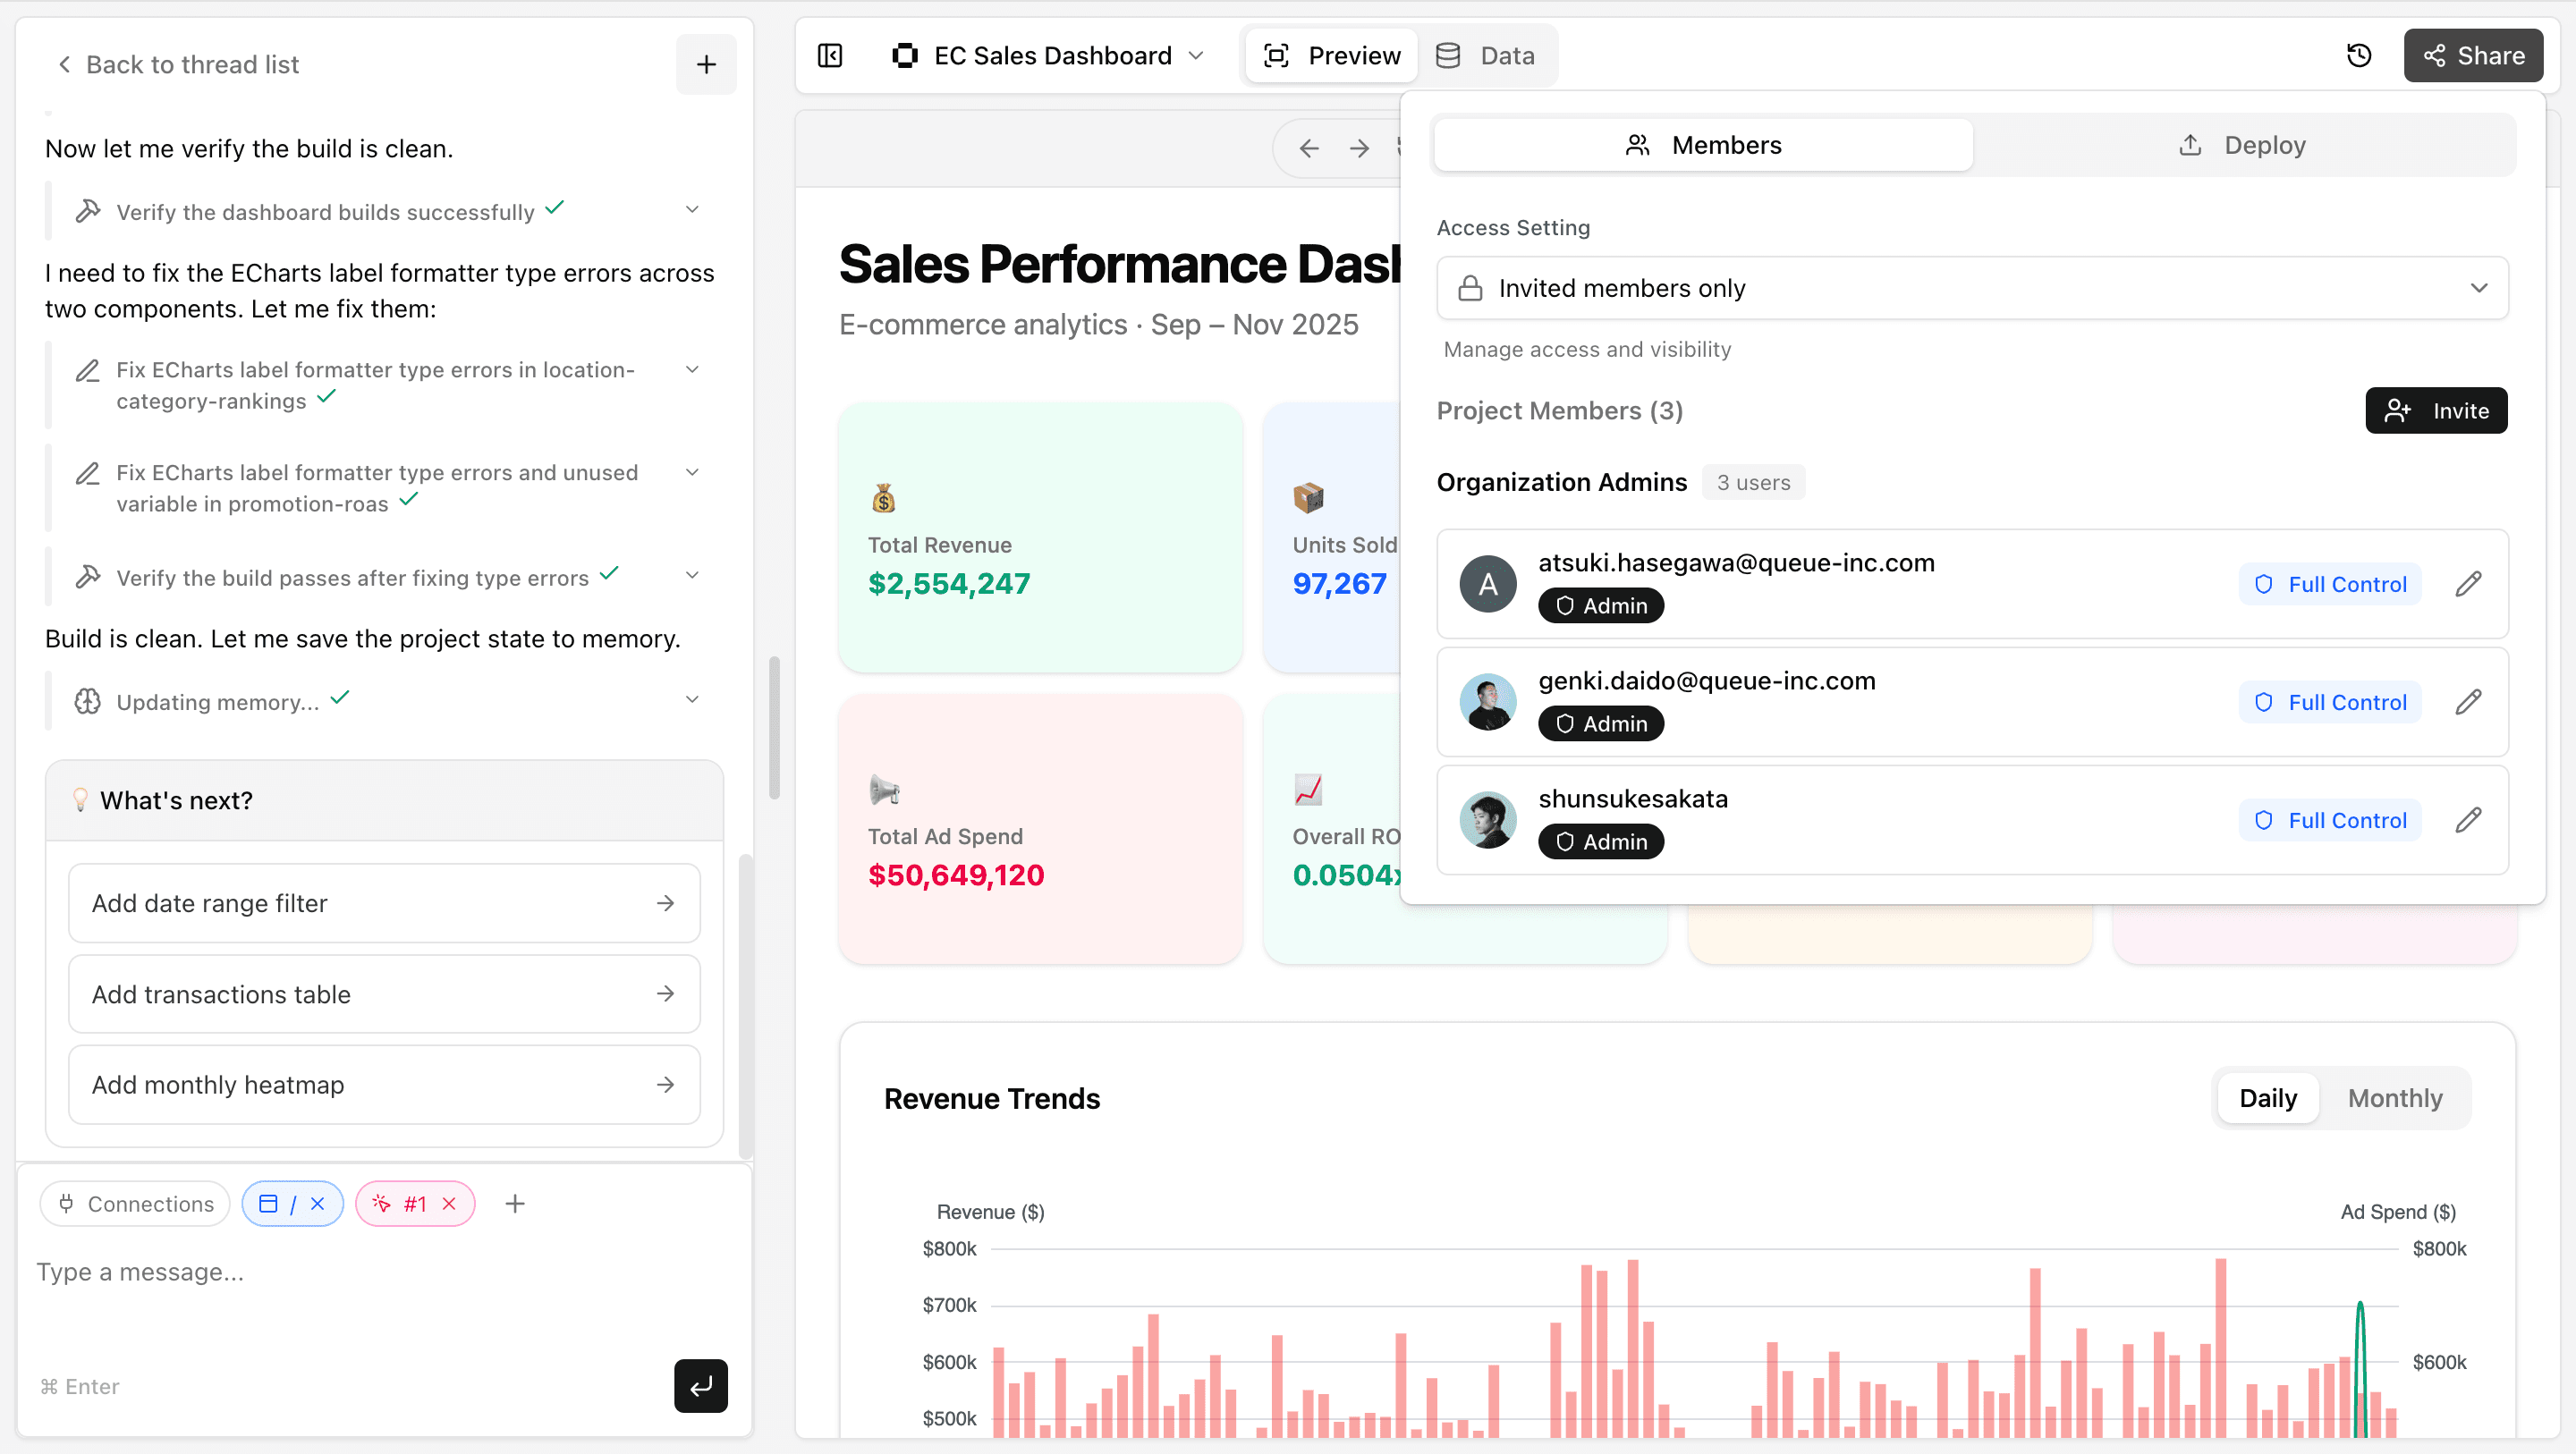
Share with Your Team
Once your dashboard is ready, share it with your team.
- Click the "Share" button in the top-right corner of the screen
- Select the Deploy tab
- Click the Publish button to start the publishing process
Publishing takes a few minutes. Click the link button shown in the image below to check the status.
Once publishing is complete, the View button on the project list becomes active and you can share the dashboard via link.
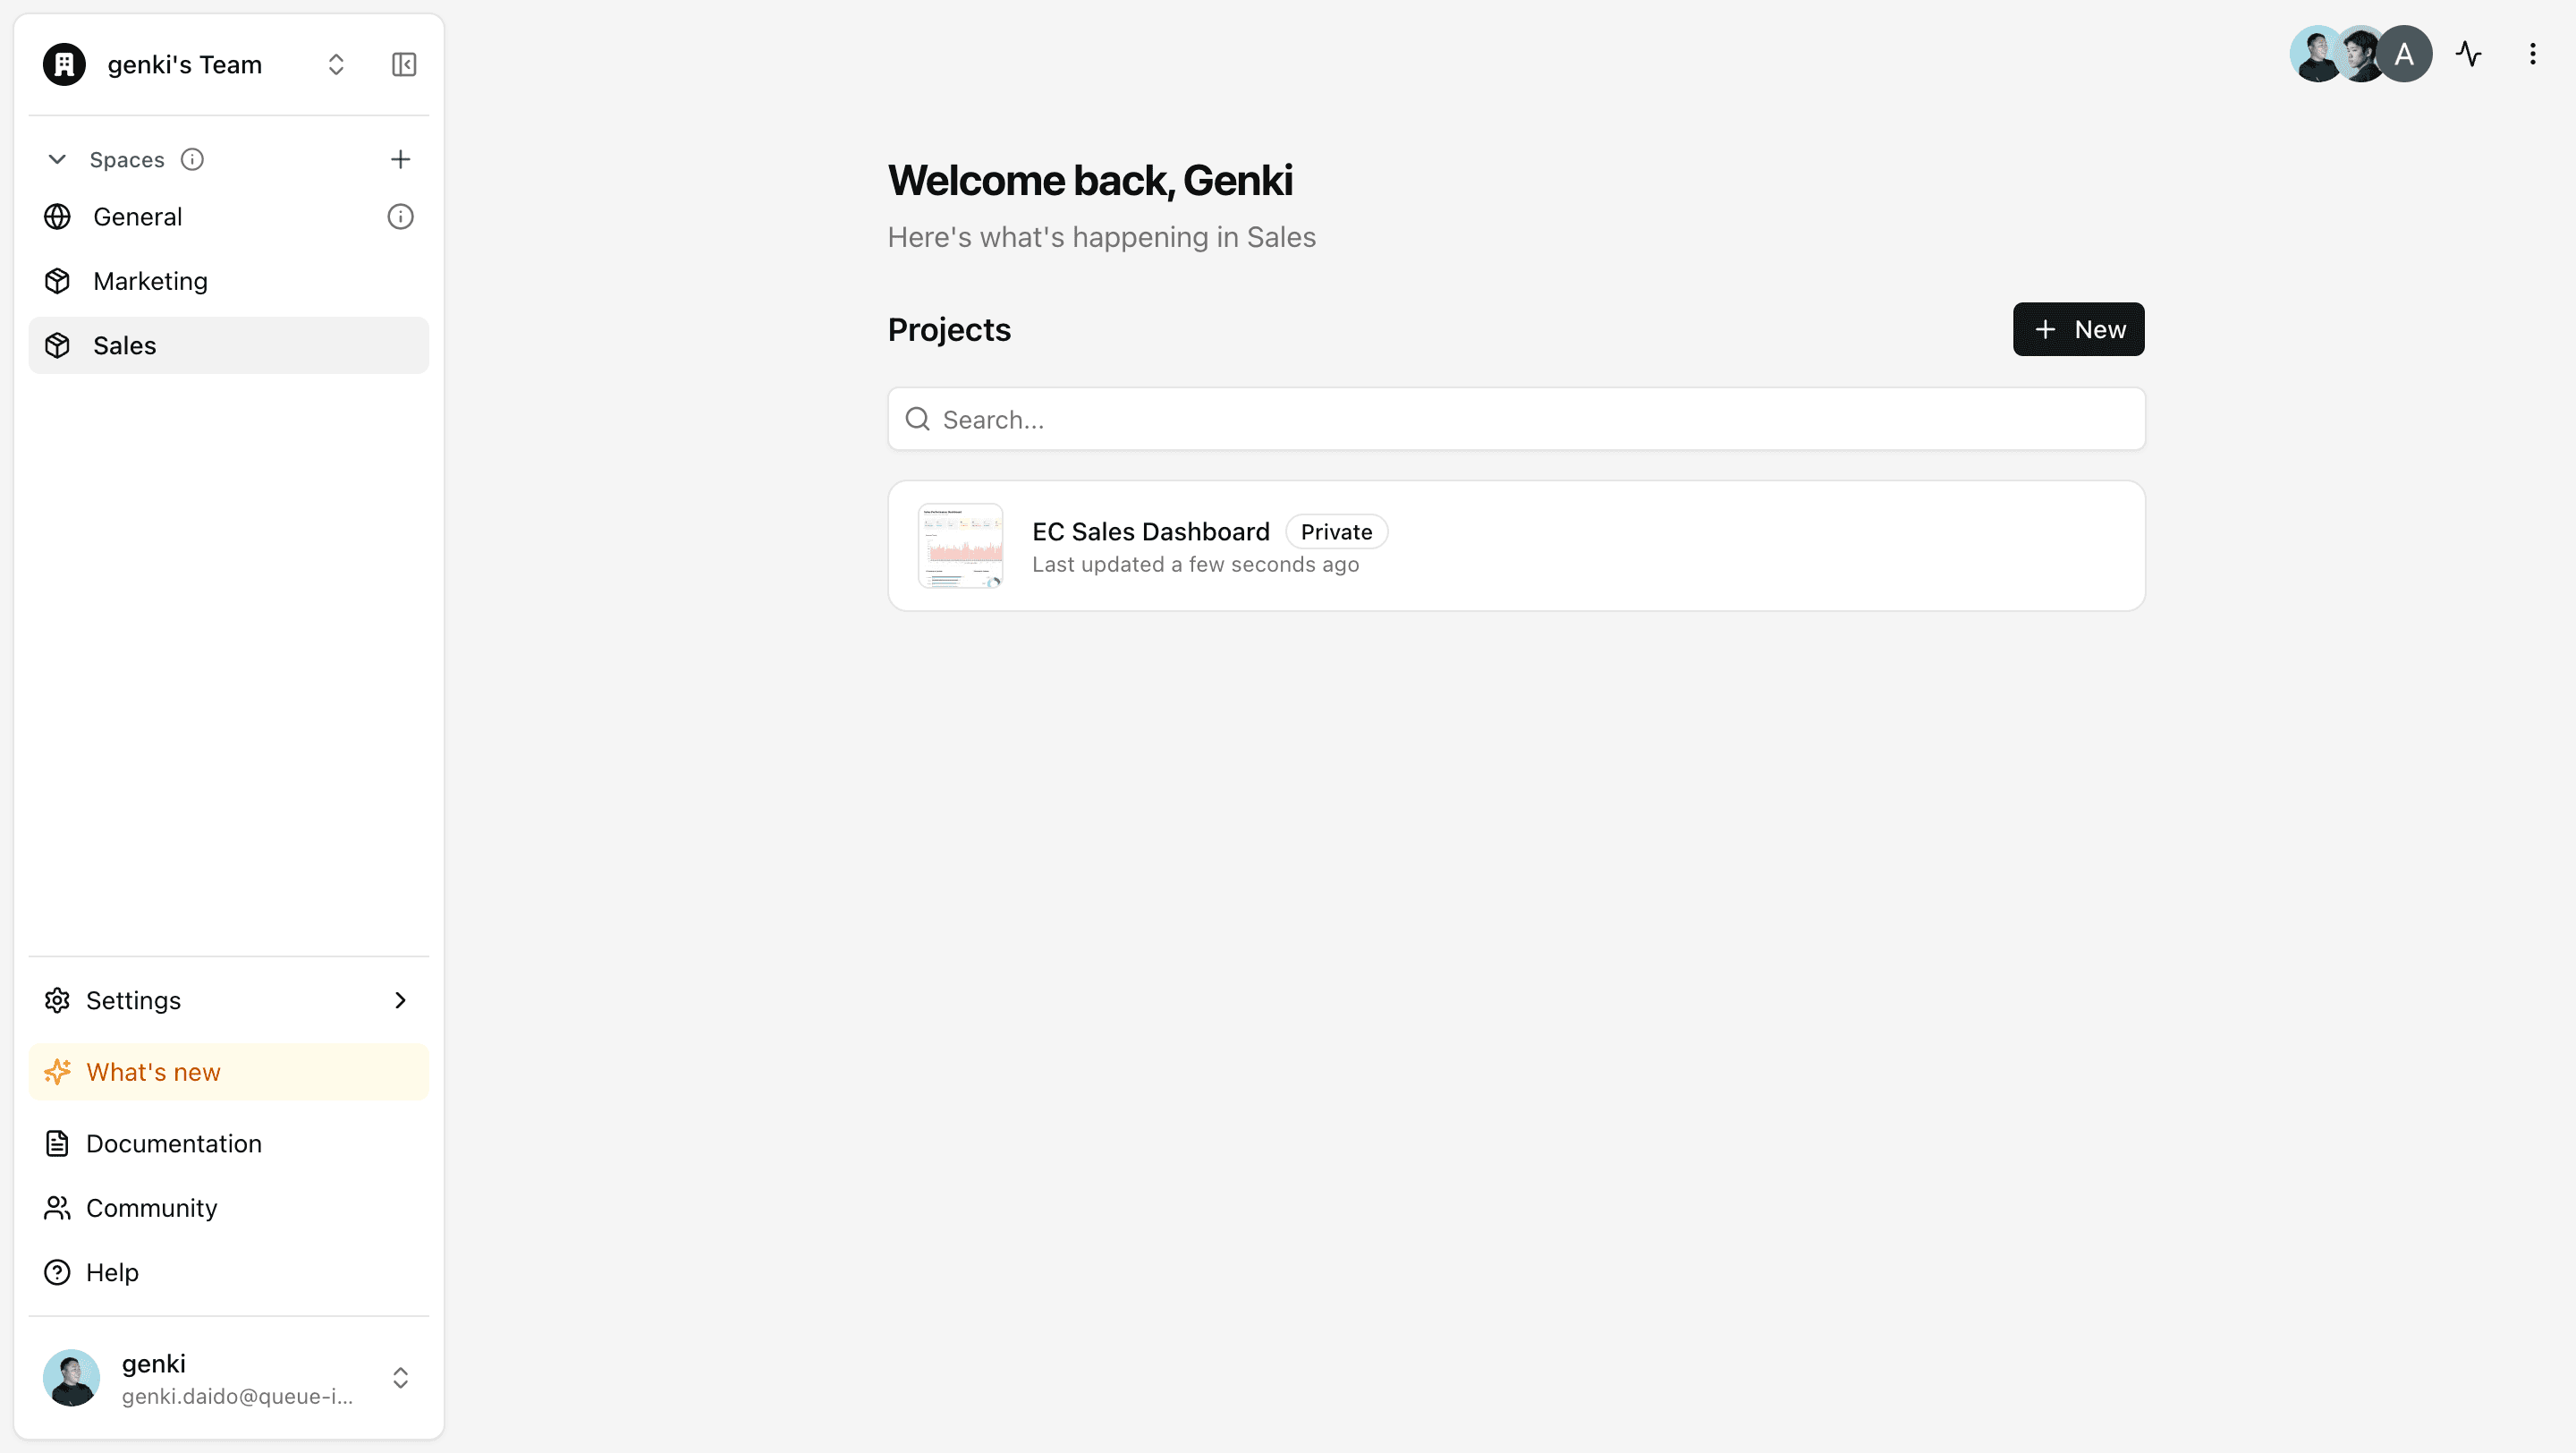
Viewing is free! Viewer licenses in Squadbase are free. Share your dashboard with your whole team and spread data-driven decision-making across your organization.
Troubleshooting
File upload fails
- Check that the file size is not too large
- Verify the file format is supported (.xlsx, .xls, .csv)
- Make sure the file isn't corrupted by opening it in another tool
AI doesn't understand my request
- Try being more specific (e.g., "Make a graph" → "Show monthly sales as a bar chart")
- Break complex requests into multiple steps
Deployment fails
If deployment fails, type "Deployment failed. Please check the logs and fix the issue." in the chat — AI will diagnose and fix problems in the codebase.